Research Article
New Approach for Analysing the Discrepancy of Pretherapeutic Tc-99m and Intra-therapeutic I-131 uptake in Scintigraphies of Thyroid Autonomies using a Parametric 3D Analysis Program
Maaz Zuhayra, Marlies Marx, Ulrich Karwacik, Yi Zhao and Ulf Lützen*
Department of Nuclear Medicine, Molecular Imaging Diagnostics and Treatment, UKSH Kiel, Karl Lennert Cancer Centre North, Feld-Str. 21, D-24105, Germany
*Address for Correspondence: Dr. med. Ulf Lützen, Department of Nuclear Medicine, Molecular Imaging Diagnostics and Treatment, UKSH Kiel, Karl Lennert Cancer Centre North, Feld-Str. 21, D-24105, Germany, Tel: 0049 431 597 3148; Fax: 0049 597 3150; Email: [email protected]
Dates: Submitted: 27 September 2016; Approved: 19 December 2016; Published: 02 January 2017
How to cite this article: Zuhayra M, Marx M, Karwacik U, Zhao Y, Lützen U. New Approach for Analysing the Discrepancy of Pretherapeutic Tc-99m and Intra-therapeutic I-131 uptake in Scintigraphies of Thyroid Autonomies using a Parametric 3D Analysis Program. J Radiol Oncol. 2017; 1: 001-011. DOI: 10.29328/journal.jro.1001001
Copyright License: 2017 Lützen et al. This is an open access article distributed under the Creative Commons Attribution License, which permits unrestricted use, distribution, and reproduction in any medium, provided the original work is properly cited
Keywords: Thyroid; Tc-99m; I-131; Parametric images; Radioiodine therapy; Thyroid autonomy

ABSTRACT
Introduction: Radioiodine therapy is a standard procedure in thyroid autonomy treatment. Discrepancies in the visual comparisons of the scintigraphies prepared for this purpose using Tc-99m-O4- and I-131 have been known for years. In this study a new method is used to calculate and perform a quantitative comparison of both uptakes using subtraction analysis and 3D imaging. The results and their causes are discussed together with practice-relevant conclusions for better clinical results.
Material and Methods: The new method was used in 38 patients with thyroid autonomies for the subtraction analysis of standardized pretherapeutic and intratherapeutic scintigraphies. The parametric distribution of activity was calculated absolutely and as a percentage and displayed three-dimensionally. These results were compared with the visual assessment of the different scintigraphies by the experts. Inclusion criteria were pretherapeutic and intratherapeutic hyperthyroidism without medication affecting the thyroid. The time difference between acquiring the scintigraphies was 28 days maximum.
Results: Activity distribution was visually discrepant in 39.5% of cases. 60.5% displayed comparable uptake. The calculated values showed reversed results after applying the new method. The results using our method show a higher rate of calculated discrepancies compared with visual analysis.
Conclusion: Accurate functional imaging of the thyroid is next to further aspects very important in establishing the diagnosis and deciding about the therapy activity for thyroid treatment. In combination with clinical symptoms and laboratory values, Tc-99m-O4 - scintigram can be used for an orientated, preliminary assessment of functional disorders of the thyroid. But because of the higher rate of found discrepancies, the solely use of Tc-99m-O4 - scintigram is not always capable for exact and reliable diagnosis. The known reason for this is most probably due to the different biokinetics of both radiopharmaceuticals, which can be imaged more sensitively with this method. Consequently, a scintigram should be performed in the pretherapeutic radioiodine uptake test. Despite higher costs and radiation exposure, alternatively, pretherapeutic use of other diagnostic iodine isotopes like I-123 or -124 should be discussed, because they could overcome the limitation of the different biokinetics. Following this approach the preliminary assessment using Tc-99m-O4 - scintigraphy can be precised and double checked to improve diagnostic confi dence and treatment results for a better outcome of the patients.
INTRODUCTION
Diagnostic thyroid scintigraphy is necessary for the decision for radioiodine therapy (RIT). The preferred nuclide used is Tc-99m-O4-, other nuclides are I-123 and I-131. In physiological terms, the iodine isotopes are the ideal diagnostic radionuclides for thyroid cintigraphy, because they reflect directly physiological iodine metabolism (trapping, iodination, iodization, hormone secretion, metabolism) [1]. I-123 therefore has a higher uptake in the thyroid than Tc-99m-O4 - with better demarcation of the thyroid from the surrounding tissue.
The primary goal of radioiodine therapy in cases of benign thyroid autonomies is to switch off the autonomous thyroid tisse [2]. The I-131 activity administered as part of the therapy is calculated according to the target dose using the Marinelli formula [3], in which the target volume, the maximum thyroidal iodine uptake and the effective half-life are taken into account. The last two parameters are determined during the pretherapeutic iodine uptake test. For determination of the target volume and the thyroid autonomy type, responsible for the target dose, a diagnostic Tc-99m-O4- scintigraphy and thyroid sonography are essential. As part of the RIT, a planar thyroid and whole-body scan are performed to determine the target dose achieved.
In the case of comparable metabolic state and either no or identical thyroid medication, it is anticipated that, the pretherapeutic Tc-99m-O4 - and the intratherapeutic I-131 scintigrams display mostly similar radiopharmaceutical distributions [4]; nevertheless, it is not unusual to find discrepancies between the scheduled target dose and the target dose achieved [2]. Differences are also known in the nuclide distributions in the intratherapeutic I-131 scintigraphy compared to the pretherapeutic Tc-99m-O4 - scintigraphy [1,5-7].
To the best of our knowledge, there is no method or program described in literature for parametric calculation and presentation of the differences between Tc-99m-O4 - and I-131 scintigraphy quantitatively using subtraction analysis of the scintigraphies (I-131 minus Tc-99m-O4-). This would enable a more individualized diagnosis and thus more definite indications, and ultimately more accurate activity calculations since, for example, the target doses differ for different types of thyroid autonomy.
The aim of this study is to provide a new method for the first time to analyze the differences in radionuclide distributions in the different scintigraphies using substraction analysis and to provide the results as three-dimensional parametric images. Possible conclusions are discussed for an optimal, individualized diagnosis and activity of radioiodine therapy for practical application to achieve better clinical results.
MATERIAL AND METHODS
Data and scintigraphies with Tc-99m-O4 - and I-131 from 38 patients (20 women and 18 men) aged between 37–94 years (66.5±17.2 and 64.6±8.9 years) with functionally relevant thyroidal autonomies (18 unifocal, 15 multifocal and 5 disseminated) were analysed. Inclusion criteria for the selection of patients for this study were a decreased TSH level (<0.27 μIU/ml) and the absence of medication affecting the thyroid both at the time of the pretherapeutic diagnostic tests and during the therapy. Due to an endogenously suppressed TSH level, this corresponded to hyperthyroidism. The time difference between acquiring the pretherapeutic Tc-99m-O4 - scintigraphies and the intratherapeutic I-131 scintigraphies during the RIT was 28 days maximum in all patients. In addition to further diagnostic procedures like ultrasound and hormone analyses of the thyroid, a pretherapeutic thyroid scintigraphy was performed with a maximum of 75 MBq Tc-99m-O4 - (Mallinckrodt, Petten, Netherlands) to image the function of the thyroid. In compliance with the guidelines, approximately 20 minutes p.i., a static thyroid planar scintigraphy was acquired over 5 to 10 minutes using a single-head gamma camera (Diacam, Siemens, Erlangen, Germany) with a low-energy high resolution (LEHR) parallel hole collimator. The images were acquired using a 128×128 matrix and stored, the Tc-99m-O4 - uptake determined, and the scintigraphies visually analysed.
With the support of laboratory results, ultrasound scan and clinical symptoms, he indication for RIT was established with the aid of the Tc-99m-O4 - scintigraphy and the individual therapy activity determined according to the Marinelli formula using the radioiodine uptake test [3]. The calculated and then administered activity was between 400 and 2000 MBq I-131 (Mallinckrodt, Petten, Netherlands). I-131 was administered orally in capsule form. The hospitalization of the patient in this study was between two to a maximum of 15 days (mean 5.5 days). Prior to discharge, a static planar thyroid I-131-scintigraphy was acquired in a 256x256 matrix using a dual-head camera (E-Cam 180, Siemens AG, Erlangen, Germany) with a high-energy (HE) parallel hole collimator over 5 to 10 minutes as well as a compulsory planar whole-body scan.
Analysis and processing of the scintigraphies
The planar Tc-99m-O4- and I-131 scintigraphies of the thyroid were first visually analyzed and compared to each other on a computer monitor by two experienced specialists in nuclear medicine in consensus on the basis of the different grey intensities (Figure 1).
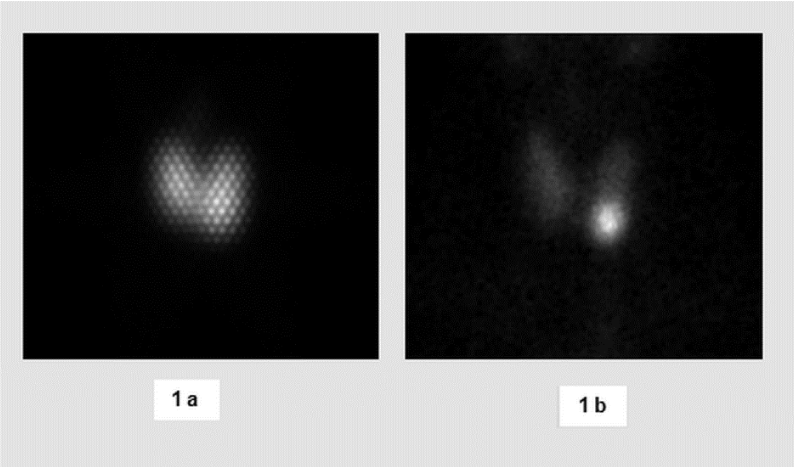
Figure 1: Patient 24, varying maximum activity in visual comparison of I-131 scintigram (1a) with the Tc-99m-O4-scintigram (1b). Grid image in Figure 1a highlighted by the use of a high-energy collimator.
The processing steps of the scintigraphies using the new program are illustrated in figure 2. The scintigrams were initially saved in DICOM format, and then the Tc- 99m-O4- and the I-131 images were opened side-by-side on the computer monitor. After visual comparison of the activity in the autonomous areas, these images were aligned congruently using the “Multi-Modality” tool integrated in the Gold 2.8 Program (Hermes Medical Solution, Sweden). The image matrix was mathematically adjusted to a 256×256 matrix. The region-of-interest (ROI) technique was then used to demarcate the thyroid from the surrounding structures and tissue.
For normalizing the scintigraphies, the quotient from the number of counts in the ROI of the I-131 and Tc-99m-O4- image was generated, and this was then used as a factor to multiply the values of the Tc-99m-O4-image.
After normalization, the Tc-99m-O4- scintigram was subtracted from the I-131 scintigram and parametrically represented (Figure 3). Because the used computer program (2.8 Gold, Hermes) can only process positive values the parametric image therefore had to be shifted into the positive range by adding the grey values along the y-axis. This process corresponds to shifting the zero level (x-axis plane) to the y-axis (Figure 2). A new image results from the subtraction, which differs from the baseline scintigrams in its grey intensities: the activity of I-131 is reproduced as light and that of Tc-99m-O4- as dark (Figures 4a-d and 5a-d).
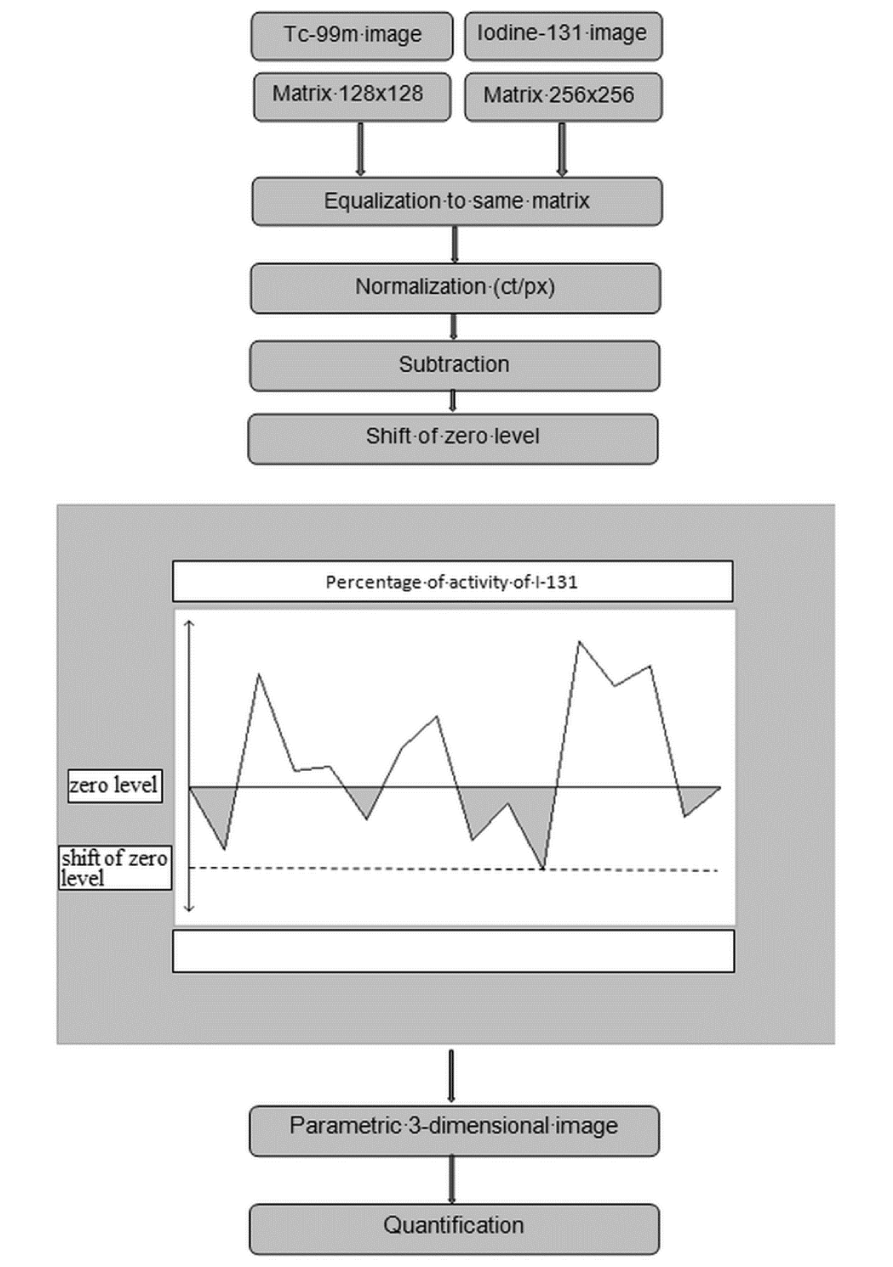
Figure 2: Data processing Flowchart.
Using the computer program (MRIcro 1.40, Chris Rorden, Nottingham University,UK) the data were separated for quantitative analysis into image and patient files and converted into the analysis format (Bio-Medical Imaging Resource, Mayo Foundation, USA). The pure image files were transferred to the Statistical Parametric Mapping Program (SPM2, Wellcome Department of Cognitive Neurology, London, UK) [8] for the MATLAB image processing program (Matrix Laboratory, Math Works, Massachusetts, USA). Using a program in MATLAB-internal language developed for this study, the grey scale values added previously to the parametric images were subtracted again and the zero level (x-axis plane) shifted back along the y-axis to the zero point. The planar subtraction scintigraphies were represented three-dimensionally in MATLAB and the corresponding values for I-131 and Tc-99m-O4- were calculated above and below zero level (Table 1). Due to the zero level correction, the values obtained for I-131 and Tc-99m-O4- were displayed as positive and negative numerical values. They represent absolute values without unit and were additionally converted into percent values (Table 1 and Figure 3).
| Table 1: 3D representation: numerical values above and below zero level of I-131 and Tc-99m in absolute values and in percent [%]. The light background indicates results where Tc-99m uptake predominates. Light grey indicates: I-131 uptake predominates, dark grey: equalized uptake (within the range of SD = ± 12.1). Av: average, SD: standard deviation, Δt: time period between therapeutic I-131 administration and intratherapeutic I-131 scintigram [d]. | |||||
| No. | I-131 | Tc-99m | Dt | ||
| positive | % | negative | % | ||
| 1 | 277046 | 47.5 | 306424 | 52.5 | 5 |
| 2 | 515967 | 58.4 | 368122 | 41.6 | 8 |
| 3 | 117950 | 48.2 | 126763 | 51.8 | 3 |
| 4 | 734766 | 43.6 | 952218 | 56.4 | 8 |
| 5 | 466069 | 29.3 | 1124971 | 70.7 | 3 |
| 6 | 332323 | 30.5 | 758965 | 69.5 | 4 |
| 7 | 287455 | 34.6 | 543460 | 65.4 | 5 |
| 8 | 370909 | 62.2 | 225666 | 37.8 | 6 |
| 9 | 142089 | 38.1 | 231739 | 61.9 | 3 |
| 10 | 400550 | 44.7 | 495488 | 55.3 | 7 |
| 11 | 199122 | 29.1 | 485380 | 70.9 | 3 |
| 12 | 269378 | 44.3 | 339212 | 55.7 | 3 |
| 13 | 357066 | 34.5 | 678482 | 65.5 | 4 |
| 14 | 450693 | 41 | 649500 | 59.0 | 4 |
| 15 | 154934 | 29.4 | 371438 | 70.6 | 8 |
| 16 | 475080 | 41.1 | 683121 | 58.9 | 5 |
| 17 | 149275 | 47.4 | 165377 | 52.6 | 3 |
| 18 | 461904 | 20.5 | 1796304 | 79.5 | 4 |
| 19 | 719937 | 51.5 | 678047 | 48.5 | 6 |
| 20 | 518817 | 50.9 | 499169 | 49.1 | 7 |
| 21 | 539046 | 60 | 359232 | 40.0 | 9 |
| 22 | 111498 | 21.1 | 417613 | 78.9 | 4 |
| 23 | 188624 | 44.7 | 233491 | 55.3 | 3 |
| 24 | 320191 | 38.1 | 519351 | 61.9 | 5 |
| 25 | 646518 | 52.5 | 585367 | 47.5 | 2 |
| 26 | 228944 | 45.3 | 276471 | 54.7 | 5 |
| 27 | 725434 | 27.8 | 1886730 | 72.2 | 5 |
| 28 | 142401 | 44.2 | 180019 | 55.8 | 7 |
| 29 | 74501 | 43.3 | 97670 | 56.7 | 3 |
| 30 | 102265 | 54.9 | 83702 | 45.1 | 15 |
| 31 | 178570 | 44.9 | 219098 | 55.1 | 6 |
| 32 | 309412 | 42.2 | 423415 | 57.8 | 6 |
| 33 | 277863 | 43.1 | 366782 | 56.9 | 4 |
| 34 | 30564 | 10.5 | 259588 | 89.5 | 8 |
| 35 | 362164 | 31.2 | 797035 | 68.8 | 8 |
| 36 | 410332 | 50.8 | 398075 | 49.2 | 7 |
| 37 | 209725 | 45.2 | 255202 | 54.8 | 8 |
| 38 | 831979 | 69.5 | 364615 | 30.5 | 7 |
| Av | 344509.50 | 42.00 | 505350.05 | 58.00 | 5.55 |
| SD | 204433.42 | 12.09 | 396327.99 | 12.09 | 2.49 |
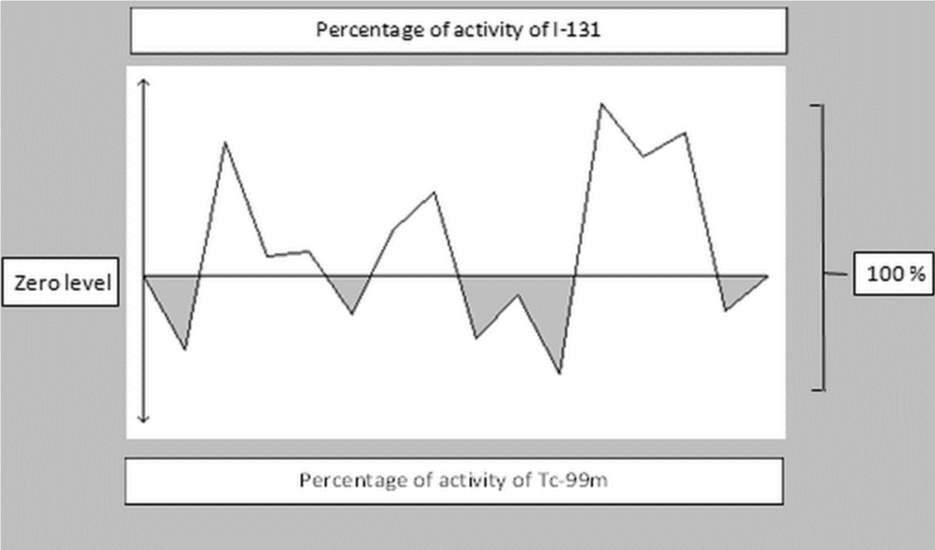
Figure 3: Diagram representing the calculation of absolute numerical values from Table 1 in percent [%]. The grey-shaded areas (here approximately 40%) represent the integral of the curves below zero level for Tc-99m-O4-; the white-shaded areas (here approximately 60 %) represent the integral of the curves above zero level for I-131.
The results obtained from the subtractions of the I-131 and Tc-99m-O4-scans are not normally distributed (column 3 and 6 in table 1). For the evaluation a range within the mean ± standard deviation of the calculated percentages was defined as a reference range. The values within this range were classified as identical. Values outside these thresholds were assigned accordingly to the I-131 or Tc-99m-O4- group.
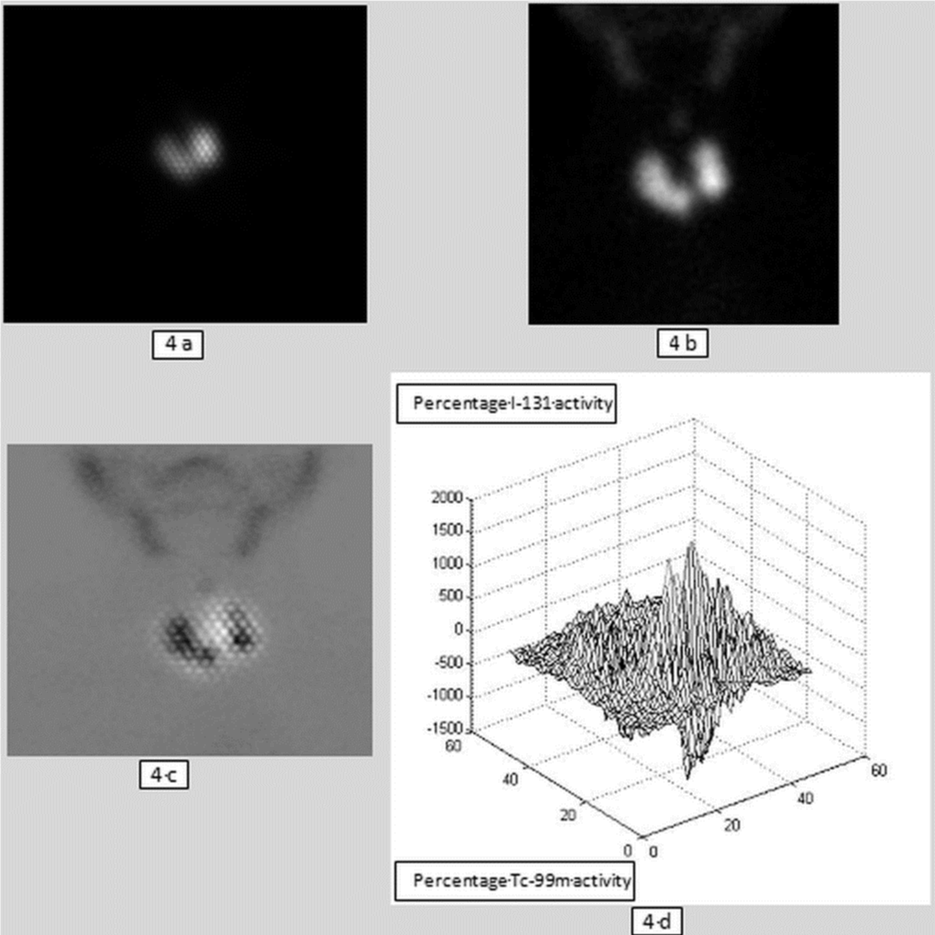
Figure 4: Patient 8, visual analysis versus mathematical analysis. 4a: I-131 scintigram: visual 4b: Tc-99m scintigram: visual Tc-99 > I-131 4c: Subtraction image (white I-131, black Tc-99m) 4d: 3D image: calculated I-131> Tc-99m (I-131 above zero level 62.2 %, Tc-99m below zero level 37.8 %)
RESULTS
Follow-up check three months after treatment revealed the metabolic state in patients without thyroid medication to be in 31 cases (81.6%) euthyroid, two cases were (5.3%) latent hypothyroid, and five (13.2%) latent hyperthyroid.
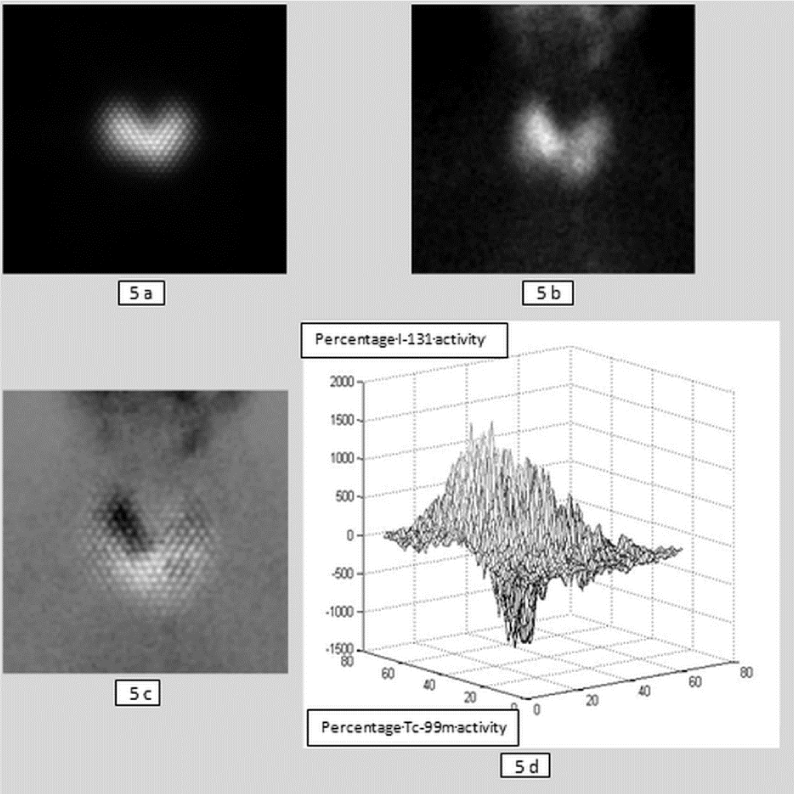
Figure 5: Patient 38, visual analysis versus mathematical analysis. 5a: I-131 scintigram: visual 5b: Tc-99m scintigram: visual I-131> Tc-99m 5c: Subtraction image (white I-131, black Tc-99m) 5d: 3D image: calculated I-131> Tc-99m (I-131 above zero level 69.5 %, Tc-99m below zero level 30.5 %)
Mathematical analysis versus visual analysis
The absolute numerical values calculated by the analysis program for the activity of I-131 and Tc-99m-O4- from the three-dimensional images as well as percentage values are presented in table 1. The values for I-131 uptake were above the zero level, those for Tc-99m-O4- below the zero level (Figure 3). The threshold value for allocating the calculated values into the respective groups was the standard deviation (±12.1).
Mathematically there was in 15 cases (39.5%) an equalized calculation of thevalues of Tc-99m-O4- and I-131, in 4 cases (10.5%) the values of I-131 were higher, and in 19 cases (50.0%) those of Tc-99m-O4- were higher (Table 2). In the visual analysis, the intensity of Tc-99m-O4- and I-131 was assessed as equalized in 23 of 38 patients (60.5%). In 12 cases (31.6%) the intensity of I-131 appeared to be higher and in 3 cases (7.9%) that of Tc-99m-O4- was higher (Table 2).
| Table 2: Visual analysis versus mathematical analysis of scintigrams and subtraction images; > values in autonomous area higher, < values in autonomous area lower, ≈ values in autonomous area equalized (within the range of SD = ± 12.1). | |||
| I-131 > Tc-99m | I-131 < Tc-99m | I-131 ≈ Tc-99m | |
| Scintigraphy (visual) | 12 | 3 | 23 |
| 3D-image (calculated) | 4 | 19 | 15 |
The time period (Δt) between the administrations of I-131 and the image acquisition timepoints of the intratherapeutic I-131 scintigrams was between two and 15 days with a mean of 5.55 days. There was no statistical evidence of a link between the intensity of I-131 and the above mentioned time period Δt (Figure 6).
Patient-related analysis of scintigrams and 3D images
The visual and mathematical analysis of I-131 and Tc-99m-O4- scintigraphies yielded different distribution patterns. There was agreement in 10 patients (26.3%) and discordance in 28 (73.7%). In 19 patients (50%), Tc-99m-O4- uptake was higher when calculated compared to the visual determination (Table 3).
| Table 3: Distribution of patient cases in groups, > values in autonomous area higher, < values in autonomous area lower, ≈ values in autonomous area equalized (within the range of SD = ±12.1). | ||||
| 3D-image (calculated) | ||||
| I-131 > Tc-99m | I-131 < Tc-99m | I-131 ≈ Tc-99m | ||
| Scintigraphy (visual) |
I-131 > Tc-99m | 1 | 7 | 4 |
| I-131 < Tc-99m | 1 | 0 | 2 | |
| I-131 ≈ Tc-99m | 2 | 12 | 9 | |
DISCUSSION
Discussion of the methods
Parametric images have the advantage that dynamic processes can be described over a defined period of time in a single static image [9–11]. Subtraction of scintigraphies with different nuclides are already in clinical use, for example, in preoperative nuclear diagnostic scans for localization of parathyroid adenomas [12,13].
To demarcate the thyroid from the background the ROI technique was applied. The ROI was manually created, and thus relies on the experience of the user. The thyroid boundaries are not always easily visible. Firstly, the boundaries of the autonomous tissue can be overestimated or, secondly, if the nuclide uptake is low, they may not be clearly demarcated resulting in a wrong assessment. We minimized these potential errors to a large extent by the experienced specialists. Overlaying could be optimized by additional external morphological marking (jugular, neck contour, lower jaw, etc.). Assessing hybrid images in the form of SPECT/CT images could result in more precise overlaying. However, the additional radiation exposure through the low-dose CT must be taken into account.
Discussion of results
The important issue for the clinical routine is whether visual evaluation of the Tc-99m-O4- scan alone should and can be used for the pretherapeutic diagnosis and dose- finding prior to RIT. Despite the known discrepancy between the respective uptakes of the radionuclides used for diagnosis and therapy, the Tc-99m-O4- uptake has been regarded as an equivalent of the I-131 uptake in RIT [4].
Our results show that the calculated uptake values of I-131 and Tc-99m-O4- deviate in parts considerably from the visual impression when viewing the scintigraphies (Tables 1 and 2). In some cases, the results are almost reversed. The visual analysis agrees with the calculated analysis in only 10 cases (26.3%). The visual grading of I-131≈ Tc-99m-O4- was in nine cases (23.7%) and of I-131> Tc-99m-O4-in one case (0.6%) identical with the computer assessment. There is a striking difference in the patient group visual I-131≈ Tc-99m-O4- versus calculated I-131< Tc-99m-O4-; the intensity of I-131 was visually estimated to be higher in 12 (31.6%) patients. A similar discrepancy is displayed in the group visual I-131> Tc-99m-O4- versus calculated I-131< Tc-99m-O4-, the intensity of I-131 was estimated to be visually seven times more intensive (Tables 3).
Discrepant nuclide uptakes of Tc-99m-O4- and I-131 or Tc-99m-O4- and I-123 have already been reported in the literature in 5-33% of the patients [6,14-18]. However these patients involved in these former studies were mostly patients with thyroid nodules and only visual analysis were carried out. Our current study cannot be compared with these studies because in our study only patients with functionally relevant thyroid autonomies have been included and a quantitative analysis has been used for the first time.
In addition, it was investigated whether the time period (Δt) from administration of I-131 to intratherapeutic I-131 scintigraphy is related to the calculated I-131 values. Due to the I-131 metabolism, the intensity could change over the time period (Δt). However, such a correlation could not be statistically identified by our results (Figure 6). The acquisition of sequential scintigrams at different timepoints following iodine administration could probably show this relationship more clearly.
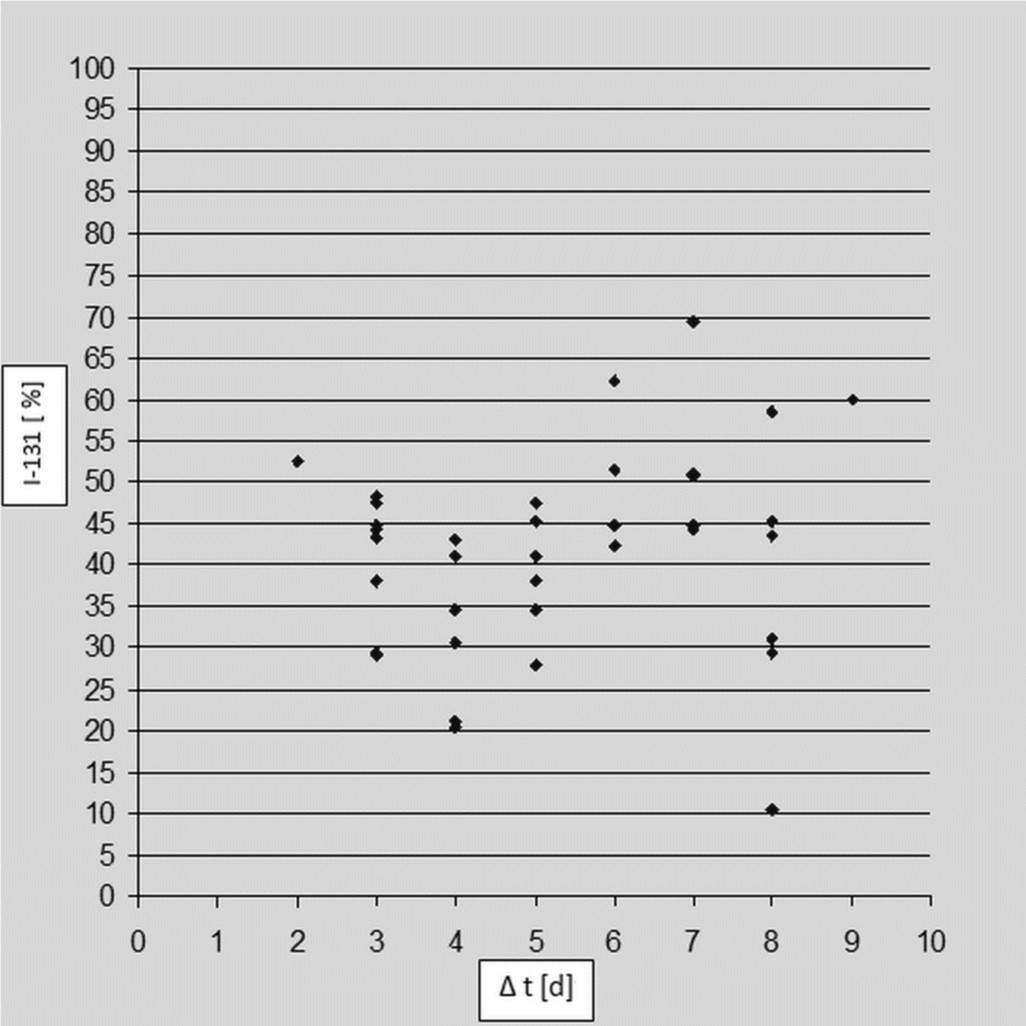
Figure 6: Diagram of the calculated I-131 values in % plotted against Δt. Δt: time period between therapeutic I-131 administration and intratherapeutic I-131 scintigram, n = 37, patient 30 was an outlier so removed from diagram.
The dose estimation based on a visual evaluation of the Tc-99m-O4- scintigraphy alone should therefore be questioned. Tc-99m-O4- and I-131 uptake have been visually evaluated as identical in 23 cases, but calculated as identical in only 15 cases. There was no congruence in the remaining cases.
In this analysis, it was not possible to make a correlation between the type of autonomy leading to RIT and the post-therapeutic metabolic state and the pretherapeutic and post-therapeutic nuclide distribution in the respective scintigraphies. This needs to be investigated in future studies.
The discrepant results can be explained by the differences in kinetics and metabolism of I-131 and Tc-99m-O4- as well as possibly changes in the thyrocytes on molecular level (changes in NIS expression, defects in iodine integration in organic compounds) [19]. Tc-99m-O4- uptake reaches a peak after approximately 20 minutes, after which it decreases. After uptake from the bloodstream, iodine is integrated specifically into organic compounds in the thyroid. I-131 accumulation continues to increase over time reaching a peak after approximately 24 hours but the time is extremely depending on the underlying thyroid disease and the individual metabolic state and possible medication affecting the thyroid [7]. Integrated iodine has a long biological half-life and is only eliminated at the physiological metabolic rate of the thyroid hormones with final metabolization in the liver and biliary excretion from the body. The intratherapeutic I-131 scintigraphy therefore shows the specific uptake in the thyroid. In the Tc-99m-O4- scintigram, the activity in the vessels and in the soft tissue of the neck is recorded as well as the activity in the thyrocytes. The varying kinetics of I-131 and Tc-99m-O4- and different molecular changes appear to have an influence on the uptake in the autonomous thyroid areas [6,19-21].
A possible option already described in the German Society of Nuclear Medicine (DGN) guidelines to optimize the individual therapy activity during radioiodine treatment is, for example, to acquire thyroid scintigrams as part of the radioiodine uptake test after 24 hours to compare a possible difference between the pretherapeutically acquired functional images of the thyroid and, if applicable, to be able to draw necessary conclusions for the subsequent treatment [22]. Another alternative to Tc-99m-O4- for the pretherapeutic functional imaging of the thyroid is the use of I-123, which is integrated specifically into the thyroid like I-131. This needs to be investigated in appropriate prospective studies.
In this study, 31 patients (81.6%) were euthyroid three months after RIT without medication. Studies with a pretherapeutic comparison of the images from the radioiodine uptake test using I-131 or I-123 could clarify whether the pretherapeutic and intratherapeutic images show a higher visual and mathematical agreement as expected, so that RIT can be optimized through more precise diagnosis and calculations of therapy activities. In addition, future studies can clarify whether the use of further tracers contribute to more precise imaging on a functional and morphological level and thus could be used to optimize the calculation of therapy activity. Freesmeyer et al. recently published an interesting study on this topic using the positron emitter I-124 and PET/CT in thyroid autonomies [23].
CONCLUSION
Our results show that the differences of the tracer accumulation of pretherapeutic Tc-99m-O4- and intratherapeutic I-131 scintigraphy can be quantified using parametric subtraction scintigraphies. The differences are more remarkable than both the expected and the reported results in this and in previous studies albeit under different conditions.
Scintigraphies with Tc-99m-O4- should be used as orientating examinations, as rapid, advantageous and preliminary diagnostic methods associated with low radiation exposure. But because of the higher rate of found discrepancies, the solely use of Tc-99m-O4- scintigram is not always capable for exact and reliable diagnosis. If there is evidence of therapy-relevant thyroid autonomy, additional scintigraphy with I-123 could improve the estimation of individual therapy activity. A pretherapeutic comparison with a scintigram during the radioiodine uptake test could also reveal possible discrepancies even before the actual RIT. So these particularities could be taken into account in the subsequent RIT for the wellbeing of the patients and their therapy results. This option would not lead to any additional radiation exposure for the patients. The additional radiation exposure due to supplementary use of I-123 or I-124, even as part of possible hybrid imaging, can be presumably accepted by considering the markedly higher intratherapeutic radiation exposure from the RIT, if a better therapeutic result can be achieved. Despite higher costs and radiation exposure, alternatively, pretherapeutic use of other diagnostic iodine isotopes like I-123 or-124 should be discussed, because they could overcome the limitation of the different biokinetics. Following this approach the preliminary assessment using Tc-99m-O4- scintigraphy can be precised and double checked to improve diagnostic confidence and treatment results for a better outcome of the patients. Pretherapeutic application of these options using different diagnostic iodine isotopes could therefore be discussed in thyroid autonomy and investigated in future studies using the method and program presented here.
REFERENCES
- Schicha H, Schober O. Nuklearmedizin – Basiswissen Und Klinische Anwendung. Vol 7. ed. Stuttgart: Schattauer 2013.
- Dietlein M, Dressler J, Grünwald F, Leisner B, Moser E, et al. [Guideline for radioiodine therapy for benign thyroid diseases (version 4)]. Nuklearmedizin. 2007; 46: 220-223. Ref.: https://goo.gl/Rop4md
- Josef K. Methodik der szintigraphischen Diagnostik bei Schilddrüsen-autonomien. Der Nuklearmediziner. 1983; 3: 175-185.
- Thorsten Kuwert, Frank Grünwald, Uwe Haberkorn, Thomas Krause. Nuklearmedizin - Thieme.de - Thieme Webshop - Thorsten Kuwert, Frank Grünwald, Uwe Haberkorn, Thomas Krause. Thieme Webshop.
- Górowski T, Chomicki OA. Some comparative studies using 99mTc and 131I in thyroid scanning. Nuklearmedizin. 1976; 15: 268-272. Ref.: https://goo.gl/vQyqJ9
- Hotze L-A, Schumm-Draeger P-M, Pfannenstiel P. Schilddrüsenkrankheiten: Diagnose Und Therapie. Berliner Med. Verlag-Anst. BMV; 2003.
- Moser E. Results of radioiodine therapy in different forms of hyperthyroidism in relation to the planned dosage. Aktuelle Radiol. 1992; 2: 179-187. Ref.: https://goo.gl/tyPsTa
- Marinelli LD. Dosage determination in the use of radioactive isotopes. J Clin Invest. 1949; 28: 1271-1280. Ref.: https://goo.gl/HdLsXP
- Strahlenschutz in der Medizin - Richtlinie zur Strahlenschutzverordnung (StrlSchV) dated 26 May 2011 (GMBl. 2011, No. 44-47, p. 867), last amended by BMUB notice dated 11 July 2014 (GMBl. 2014, No. 49, p. 1020). 2011.
- Friston KJ, Holmes AP, Worsley KJ, Poline J-P, Frith CD, et al. Statistical parametric maps in functional imaging: A general linear approach. Hum Brain Mapp. 1994; 2: 189-210. Ref.: https://goo.gl/rjViBv
- Goris ML. Parametric images as a tool for quantitative normative evaluation. Semin Nucl Med. 1987; 17: 18-27.https://goo.gl/kPN6AK
- Kolbert KS, Hamacher KA, Jurcic JG, Scheinberg DA, Larson SM, et al. Parametric images of antibody pharmacokinetics in Bi213-HuM195 therapy of leukemia. J Nucl Med. 2001; 42: 27-32. Ref.: https://goo.gl/Lg8o4a
- Chen Q. Parametric imaging of patient pharmacokinetics. Eur J Nucl Med. 1997; 24: 1369-1373. Ref.: https://goo.gl/aqcX81
- Delorme S, Hoffner S. [Diagnosis of hyperparathyroidism]. Radiol. 2003; 43: 275-283. Ref.: https://goo.gl/LSiERH
- Schommartz B, Cupisti K, Antke C, Schmidt D, Knoefel WT, et al. Localisation of parathyroid glands using planar (99m)Tc-sestamibi scintigraphy. Comparison between subtraction- and dual-phase technique. Nuklearmedizin. 2006; 45: 115-121. Ref.: https://goo.gl/KH3n9Q
- Arnold JE, Pinsky S. Comparison of 99mTc and 123I for thyroid imaging. J Nucl Med. 1976; 17: 261-267. Ref.: https://goo.gl/3Qtx4K
- Atkins HL, Klopper JF, Lambrecht RM, Wolf AP. A comparison of technetium 99M and iodine 123 for thyroid imaging. Am J Roentgenol Radium Ther Nucl Med. 1973; 117: 195-201. Ref.: https://goo.gl/Zw4ZAZ
- Dige-Petersen H, Kroon S, Vadstrup S, Andersen ML, Roy-Poulsen NO. A comparison of 99Tc and 123I scintigraphy in nodular thyroid disorders. Eur J Nucl Med. 1978; 3: 1-4. Ref.: https://goo.gl/FAC3Bz
- Ryo UY, Vaidya PV, Schneider AB, Bekerman C, Pinsky SM. Thyroid imaging agents: a comparison of I-123 and Tc-99m pertechnetate. Radiology. 1983; 148: 819-822. Ref.: https://goo.gl/dfHujP
- Szonyi G, Bowers P, Allwright S, et al. A comparative study of 99mTc and 131I in thyroid scanning. Eur J Nucl Med. 1982; 7: 444-446. Ref.: https://goo.gl/bfxSiU
- Meller J, Becker W. The continuing importance of thyroid scintigraphy in the era of high-resolution ultrasound. Eur J Nucl Med Mol Imaging. 2002; 29 Suppl 2: S425-S438. Ref.: https://goo.gl/5uzxVX
- Schaub W. [Radioiodine studies with 1231]. Nukl Nucl Med. 1976; 15: 259-261. Ref.: https://goo.gl/H1n4IT
- Usher MS, Arzoumanian AY. Thyroid nodule scans made with pertechnetate and iodine may give inconsistent results. J Nucl Med Off Publ Soc Nucl Med. 1971; 12: 136-137. Ref.: https://goo.gl/6Pv9DD
- Freesmeyer M, Kühnel C, Westphal JG. Time effi cient 124I-PET volumetry in benign thyroid disorders by automatic isocontour procedures: mathematic adjustment using manual contoured measurements in low-dose CT. Ann Nucl Med. 2015; 29: 8-14. Ref.: https://goo.gl/H4nkHO