
More Information
Submitted: April 19, 2021 | Approved: April 26, 2021 | Published: April 27, 2021
How to cite this article: Zhou Z, Zhang G, Xu T, Lin H, Zhang X. HRCT imaging features of systemic sclerosis-associated interstitial lung disease. J Radiol Oncol. 2021; 5: 035-041.
DOI: 10.29328/journal.jro.1001036
Copyright License: © 2021 Zhou Z, et al. This is an open access article distributed under the Creative Commons Attribution License, which permits unrestricted use, distribution, and reproduction in any medium, provided the original work is properly cited.
Keywords: Systemic sclerosis; Interstitial lung disease; High resolution computed tomography

HRCT imaging features of systemic sclerosis-associated interstitial lung disease
Zexuan Zhou, Guangfeng Zhang, Ting Xu, Haobo Lin and Xiao Zhang*
Department of Rheumatology and Immunology, Guangdong Provincial People’s Hospital (Guangdong Academy of Medical Sciences), Guangzhou, China
*Address for Correspondence: Xiao Zhang, Department of Rheumatology and Clinical Immunology, Guangdong General Hospital and Guangdong Academy of Medical Sciences, 22nd Floor, Main Building, No. 106 Zhongshan 2nd Road, Guangzhou, Guangdong Province 510080, China, Tel: 86-13922255387; Email: [email protected]
Background: The aim of the study was to evaluate radiographic features of systemic sclerosis-associated interstitial lung disease.
Patients and methods: 116 patients with systemic sclerosis-associated interstitial lung disease (SSc-ILD) from 2010 to 2019 comprised our retrospective study. All patients were subject to high resolution computed tomography (HRCT). ILD patterns were classified into 7 patterns as IIPs and analyzed with pathology. We chose two staging method and two semi-quantitative score methods to evaluate the HRCT performance and analyzed with pulmonary function tests.
Results: Ground-glass opacities were the most common presentation on HRCT, followed by interlobular septal thickening, reticular opacities, intralobular interstitial thickening; honeycombing, traction bronchiectasis and nodules can also be observed. The most common pattern of SSc-ILD was nonspecific interstitial pneumonia (NSIP), secondly was UIP. There was no difference in ILD pattern between HRCT and pathology, and revealed a high congruence. The four HRCT evaluating methods presented in this study all had significant relationships with PETs.
Conclusion: The most common pattern of SSc-ILD was nonspecific interstitial pneumonia (NSIP). The ILD patterns of HRCT coincide very well with histology, and will replace pathology as the gold standard for diagnosis and evaluation of SSc-ILD.
Systemic sclerosis (SSc), also known as scleroderma, is a multisystem connective tissue disease, causes fibrosis in skin, visceral interstitium and blood vessel, resulting in lung, digestive tract, heart, kidney and other internal organs involved. Pulmonary involvement is common in SSc, interstitial lung disease has become one of the main causes of death in patients with systemic sclerosis [1]. Although histological diagnosis is the gold standard for diagnosis of interstitial lung disease, its invasive nature severely limits its clinical application, high resolution computed tomography (HRCT) as a noninvasive method with repeatability and high consistency with tissue pathology has become the important examination of diagnosis, classification, evaluation in interstitial lung disease. In addition, pulmonary function test is also a sensitive examination to evaluate the severity and progression of interstitial lung disease, and is the objective indicator to evaluate pulmonary ventilation function and diffusion function.
Patients
The study design was a single-center retrospective review, collected clinical data of patients with SSc-ILD who were admitted to the Department of Rheumatology and Immunology, Guangdong Provincial People’s Hospital from January 2010 to December 2019. A total of 116 clinically stable patients were enrolled in this study, made up of 26 males and 90 females, in which 32 patients had reviewed HRCT every year with a follow-up longer than 5 years. The diagnosis of SSc was based on the 1980 American College of Rheumatology criteria for SSc [2] or the 2013 American College of Rheumatology (ACR) and European League Against Rheumatism (EULAR) classification criteria [3]. Diagnostic criteria for interstitial lung disease refers to the 2011 ATS/ERS/JRS/ALAT statement for IPF [4] and the 2013 ATS/ERS classification of idiopathic interstitial pneumonias(IIPs) [5], considering altogether with clinical presenting features, radiologic findings, pulmonary function tests and pulmonary pathology. The inclusion criteria for the study population were as follows (fit two or more items, must include b): a. had a chronic course presenting activity-related dyspnea, cough, chest tightness or auscultatory velcro rales in both lungs; b. chest HRCT showed pulmonary interstitial fibrosis such as ground-glass opacities, reticular opacities, traction bronchiectasis and honeycombing; c. pathological analysis of Lung tissues were confirmed to the 2013 ATS/ERS classification of IIPs; d. pulmonary function tests indicated restrictive ventilatory dysfunction or diffusion dysfunction carbon monoxide diffusion capacity. The exclusion criteria were as follows: malignant tumor, overlap syndromes, pulmonary infection, pregnant women, other known causes of interstitial lung disease, such as domestic or occupational environmental exposure, and drug toxicity.
HRCT chest scanning and image processing
Patients were examined using light speed 64-row spiral CT scanner in the supine position. Scan range: from the apex to the costophrenic angle (including the entire lung), lengths of around 30 to 40 cm. The scan parameters were 120 kV tube voltage, 250 mAs tube current, slice thickness: 5.0 mm, pitch: 0.625 mm, rotation time: 1 s. imaging data was reconstructed into 1 or 1.25 mm slice thickness with a soft-tissue algorithm for mediastinal window image, and a lung algorithm for lung window image.
HRCT images analysis
Two radiologists with expertise in chest radiology, who were blinded to the diagnosis and clinical data, reviewed all HRCT images independently to evaluate HRCT criteria for the ILD pattern. Chest HRCT performance described as follow: ground-glass opacities(GGO), interlobular septal thickening, intralobular interstitial thickening, reticular opacities, traction bronchiectasis, honeycomb cysts(HCs)/honeycombing, nodules, consolidation, stripes, emphysema, bullae, pleural thickening, pleural effusion, subpleural line, mediastinal lymph node enlargement, dilation of the esophagus [6,7].
HRCT patterns
Refer to the 2013 ATS/ERS classification of IIPs [5], according to the characteristics of HRCT images, baseline HRCT ILD patterns were classified into usual interstitial ipneumonia (UIP), nonspecific interstitial pneumonia(NSIP), organizing pneumonia(OP), diffuse alveolar damage(DAD), respiratory bronchiolitis(RB), desquamative interstitial pneumonia(DIP), lymphocytic interstitial pneumonia(LIP).
HRCT evaluation method
Currently, no consistent criteria were established to evaluate ILD severity using HRCT, we chose the following four methods. The first two are qualitative methods, the other two are semi-quantitative score methods.
Staging method
According to HRCT findings, three stages were classified as follows: stage I also called the early stage or active stage, presented with ground-glass opacities or interlobular septal thickening; stage II also called the progressive stage, presented with subpleural line, consolidation or nodules based on stage I; stage II also called the advanced stage, presented with reticular opacities, traction bronchiectasis, honeycomb cysts, stripes or diffuse fibrosis [8].
Severity staging system
Integrating disease extent on HRCT and FVC values, patients were distributed into two groups. HRCT extent was graded as definitely greater than 20%, definitely less than 20%, or indeterminate. HRCT exent greater than 20% or indeterminate with FVC < 70% was classified as extensive stage; HRCT exent less than 20% or indeterminate with FVC ≥ 70% was classified as limited stage [9].
Kazerooni scoring method
The extent of each abnormality was estimated for each lung lobe. In the first part, it scored ground glass opacity using 0-5: 0 meant no GGO; 1 meant GGO involved ≤ 5% of the lobe; 2 meant 5% to < 15%; 3 meant 25% - 49%; 4 meant 50% - 75%; 5 meant GGO involved > 75% of the lobe. To scoring the fibrosis, 0 meant no fibrosis, 1meant interlobular septal thickening without honeycombing, 2 meant honeycombing (with or without interlobular septal thickening) involving < 25% of the lobe, 3 meant 25% - 49%, 4 meant 50% - 75%, 5 meant > 75%. In final, it used the average score of 5 lobes to represent the final score of GGO and fibrosis [10].
Goldin scoring method
This method divided the lung into six regions (unilateral lung was divided into upper, meddle and lower regions bounded by aortic arch and inferior pulmonary veins) and scored pure ground-glass opacity, pulmanory fibrosis honeycomb cysts and emphysema in each region using a scale from 0 to 4, as follows: 0, absent; 1,1% to 25%; 2, 26% to 50%; 3, 51% to 75%; and 4, 76% to 100% [11].
Pulmonary function tests
Ventilation function indicators included forced vital capacity (FVC), forced expiratory volume in the first second (FEV1), FEV1/FVC, total lung capacity (TLC) and diffusion capacity of carbonmonoxide (DLCO). Because of the variance between different age, weight and height, data were expressed as the actual values as the percentages of predictive value. The ventilatory functions of patients were classified into one of four categories: normal ventilatory function, obstructive ventilatory dysfunction, restrictive ventilatory dysfunction, or mixed ventilatory dysfunction, and assessed according to ATS/ERS guidelines [12]. The degree of severity of any spirometric abnormality was based on the forced expiratory volume in one second (FEV1), as shown in table 1, the degree of severity of decrease in diffusing capacity for carbon monoxide (DLCO), as shown in table 2.
| Table1: The degree of severity of ventilatory functions. | |
| Degree of severity of ventilatory functions | FEV1% pred |
| Normal | ≥ the lower limit of normality (LLN) |
| Mild | ≥ 70% but below the LLN |
| Moderate | 60-69% |
| Moderately severe | 50-59% |
| Severe | 35-49% |
| Very severe | < 35% |
| Table 2: The degree of severity of decrease in DLCO. | |
| Degree of severity of decrease in DLCO | DLCO% pred |
| Normal | ≥the lower limit of normality (LLN) |
| Mild | > 60% and < LLN |
| Moderate | 40-60% |
| Severe | < 40% |
Follow-up evaluation
32 patients had completed the five–year follow up, and reviewed HRCT and PFTs more than 2 times. We collected the results and divided them into stable group, improve group and progresive group respectively. The OMERACT CTD-ILD Working Group proposed ≥ 10% relative decline in forced vital capacity (FVC) or ≥ 5% to < 10% relative decline in FVC and ≥ 15% relative decline in DLCO as the clinically meaningful progression for CTD-ILD [13] in addition, we defined ≥ 5% improve in FVC or recover to ≥ 70% as improvement; < 5% improve in FVC or < 10% relative decline in FVC as stability. For HRCT, the definition of progress was ≥ 5% enlarge in extent of ≥ 5% active lesion such as GGO or septal thickening or enlarge in extent of irreversible lesions; active lesion ≥ 5% reduced or completely disappeared was improvement; active lesion changed < 5% and no enlargement in irreversible lesions was defined as stability.
Statistical methods
The data was statistically analyzed using SPSS 25.0 statistical software. Statistically significant difference, p < 0.05.
HRCT images
The most common presentation on HRCT were ground-glass opacities, showed 79.3% (92 patients). Secondly, 74.1% patients showed interlobular septal thickening, followed by reticular opacities(58.6%), intralobular interstitial thickening(45.7%), mediastinal lymph node enlargement(36.2%), nodules(30.2%), honeycomb cysts (29.3%), traction bronchiectasis(21.6%), stripes(17.2%), pleural thickening(14.7%), pleural effusion(10.3%), dilation of the esophagus(6.9%), emphysema(6.9%), bullae(5.2%), consolidation(5.2%), subpleural line(0.9%) (Figures 1-9).
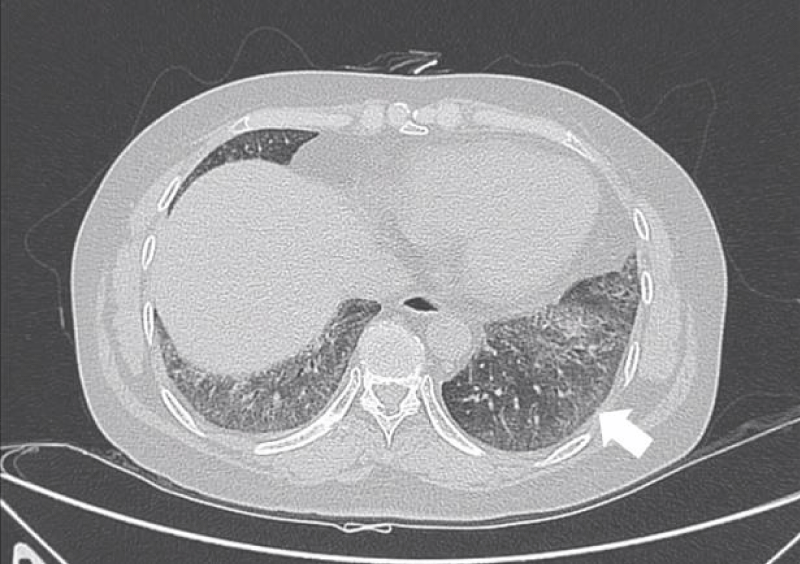
Figure 1: Ground-glass opacities.
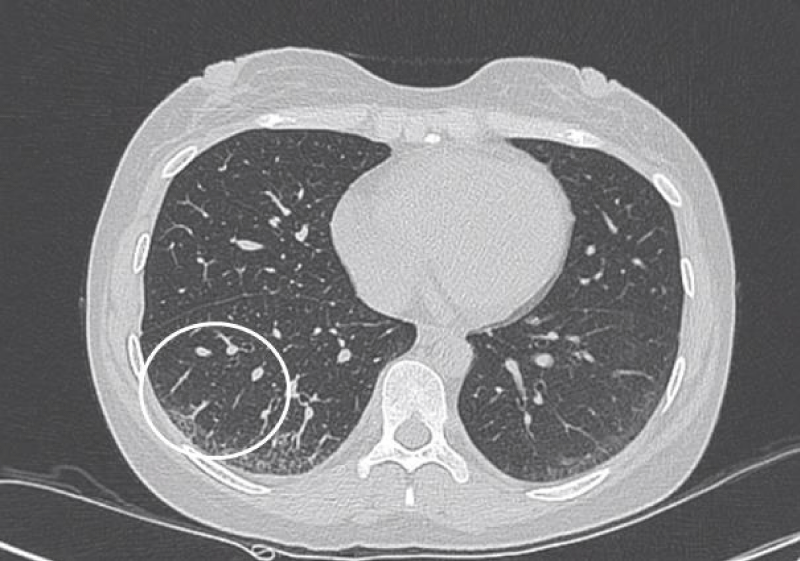
Figure 2: Interlobular septal thickening.
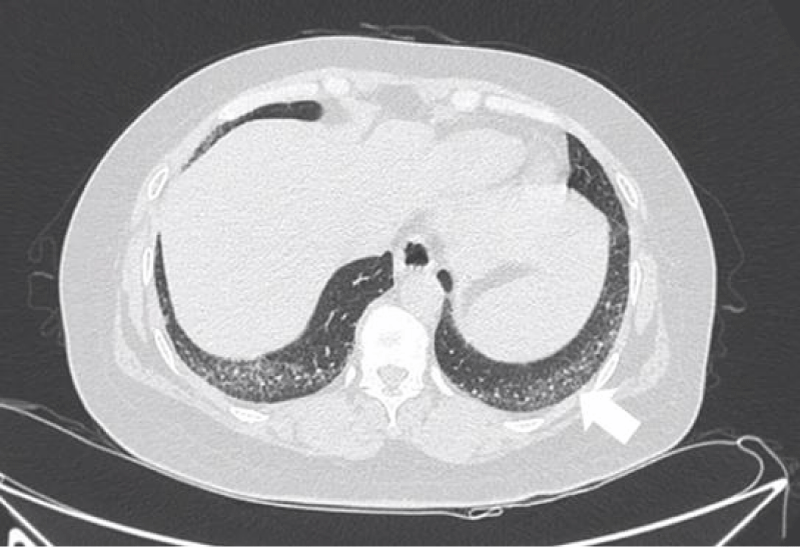
Figure 3: Intralobular septal thickening.
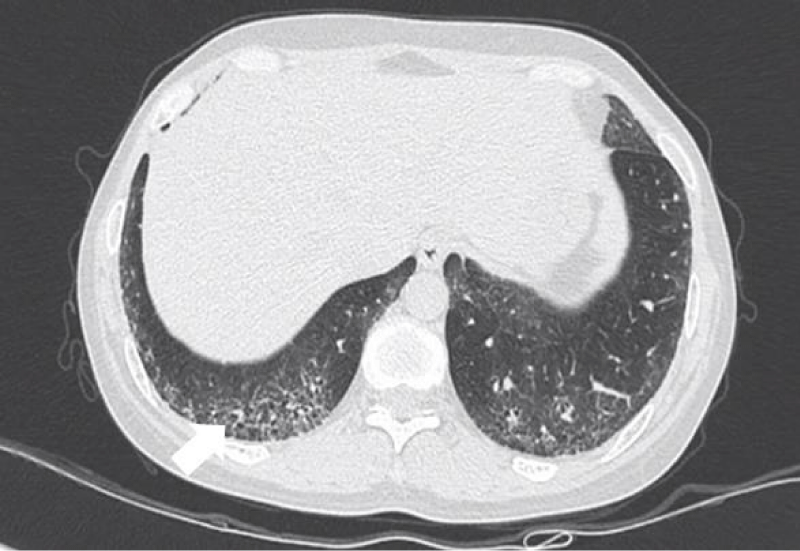
Figure 4: Reticular opacities.
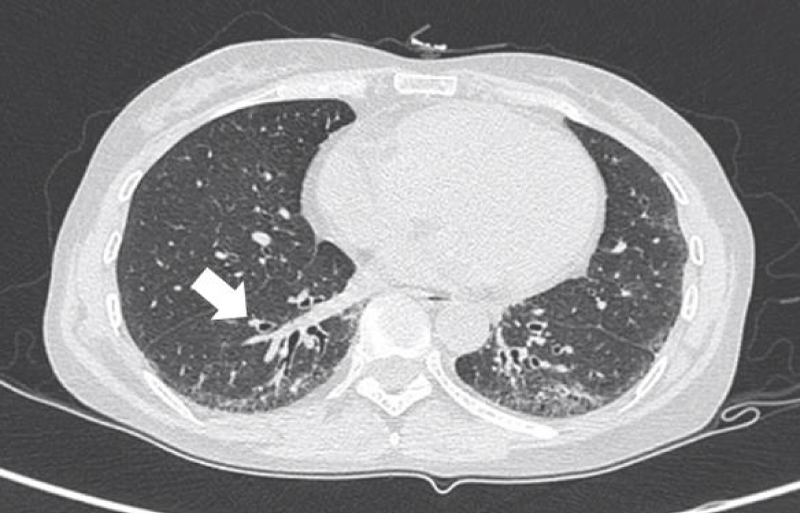
Figure 5: Traction bronchiectasis.
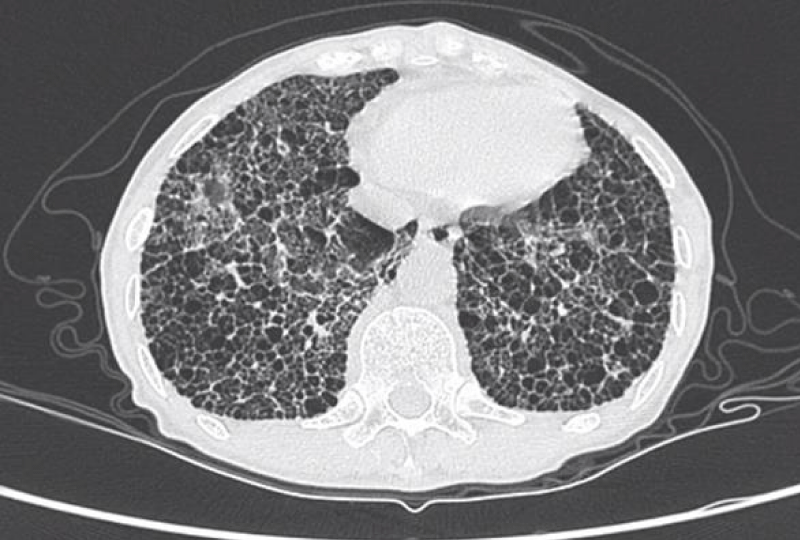
Figure 6: Honeycomb cysts.
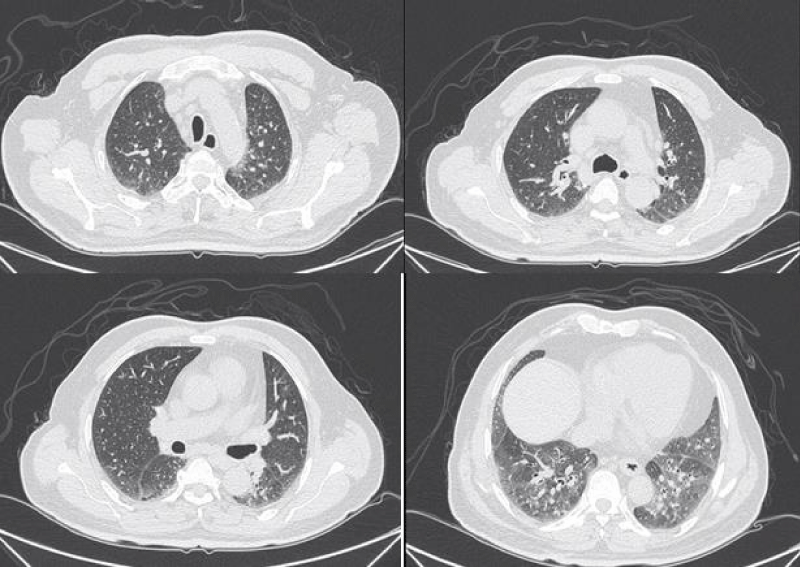
Figure 7: Different levels HRCT images from a 65 year-old male considered as NSIP pattern.
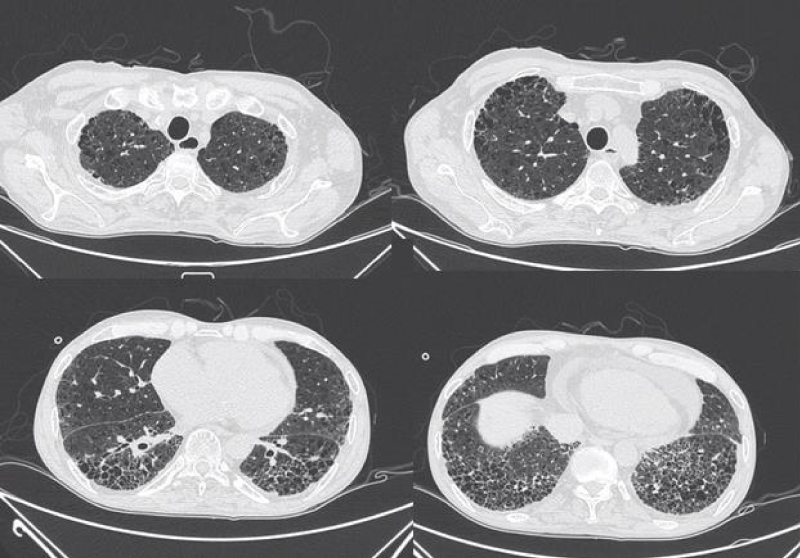
Figure 8: Different levels HRCT images from a 54 year-old male considered as UIP pattern.
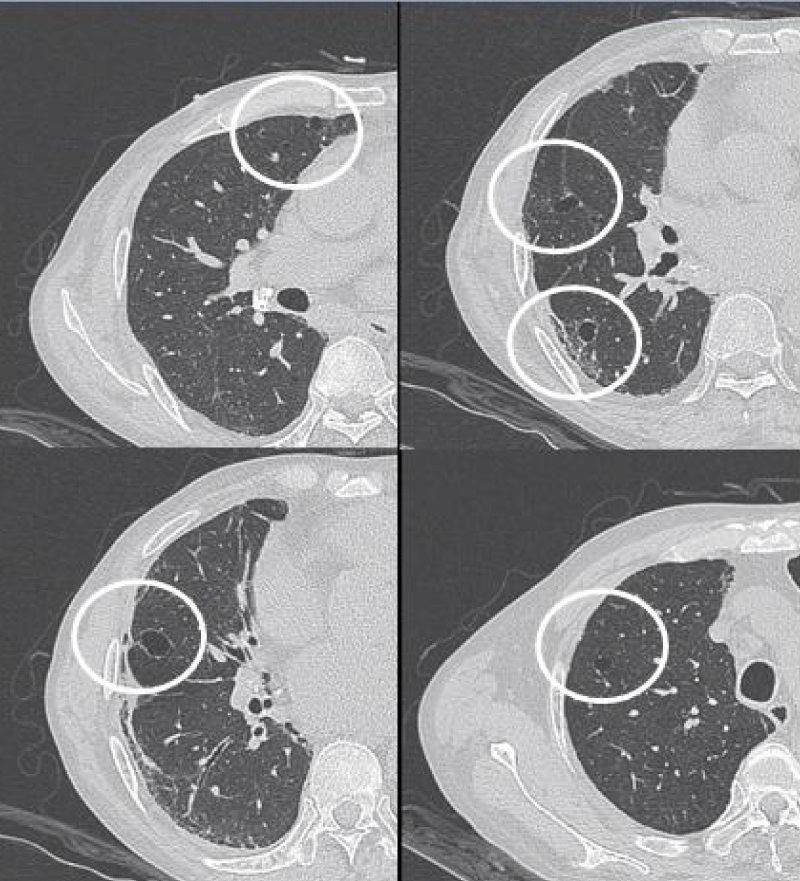
Figure 9: Different levels HRCT images from a 52 year-old male considered as LIP pattern.
HRCT patterns
The most common pattern in SSc-ILD was NSIP, accounted for 71.6% (83 patients); secondly was UIP, accounted for 25.9%, and 3 patients presented consistent with LIP.
Concordance analysis between HRCT and pathology
36 patients with the NSIP pattern on HRCT scan underwent lung biopsy showed 34 NSIP and 2 UIP; 8 patients with the UIP pattern underwent lung biopsy showed 7 UIP, 1NSIP; one patient showed LIP pattern both HRCT and pathology.
We evaluated using chi-square test and the kappa coefficient to analyse HRCT pattern and pathology pattern. The results suggest that there was no difference between the two methods, the kappa coefficient between the two methods was 0.805 (p < 0.001), revealed a high congruence (k ≥ 0.7) (Table 3).
| Table 3: Relation between ILD patterns classified by HRCT and pathology. | |||||
| pathological pattern | p value | ||||
| NSIP | UIP | LIP | |||
| HRCT pattern | NSIP | 34 | 2 | 0 | 0.564 |
| UIP | 1 | 7 | 0 | ||
| LIP | 0 | 0 | 1 | ||
| Statistically significant difference, p < 0.05. | |||||
HRCT evaluation
Using the staging method, the common stage was stage III, accounting for 65.5% (76 patients); stage I and II accounted for 27.6%, 6.9% respectively. For the severity staging system, 60.3%(70 patients) presented extensive stage, the remaining was limited. The mean score of GGO in Kazerooni scoring method was 1.84 ± 1.15, and the fibrosis score was 1.42 ± 0.77. The total score of Goldin scoring method was 14.35 ± 6.18 (GGO 7.15 ± 3.94, PF 5.58 ± 2.91, HCs 1.36 ± 2.66 and emphysema 0.28 ± 1.05).
Analyses between the four HRCT evaluation methods
Using the two semi-quantitative score methods to score different stage in staging method and severity staging system, the results of data analyses were as follows. The extensive stage had higher scoring than limited stage both Kazerooni scoring method and Goldin scoring method. In the staging method, patients in stage III had the highest scoring. Goldin scoring method correlated positively with both GGO score and PF score in Kazerooni scoring method (Tables 4-6).
| Table 4: Analyses between staging method and Kazerooni scoring method/ Goldin scoring method. | |||||
| Staging method | |||||
| Stage I | Stage II | Stage III | p value | ||
| Kazerooni scoring method | GGO | 1.43 ± 1.01 | 0.91 ± 0.97 | 1.75 ± 1.18 | 0.004* |
| PF | 0.81 ± 0.66 | 0.89 ± 0.52 | 1.57 ± 0.80 | <0.001* | |
| Goldin scoring method | 9.72 ± 5.93 | 7.24 ± 4.42 | 14.75 ± 6.65 | <0.001* | |
| *Statistically significant difference, p < 0.05. | |||||
| Table 5: Analyses between severity staging system and Kazerooni scoring method/ Goldin scoring method. | ||||
| Severity staging system | ||||
| Limited stage | Extensive stage | p value | ||
| Kazerooni scoring method | GGO | 0.82 ± 0.64 | 2.26 ± 1.05 | < 0.001* |
| PF | 0.75 ± 0.50 | 1.72 ± 0.78 | < 0.001* | |
| Goldin scoring method | 6.90 ± 3.65 | 17.51 ± 4.85 | < 0.001* | |
| *Statistically significant difference, p < 0.05. | ||||
| Table 6: Analysis of the correlation among Kazerooni scoring method and Goldin scoring method. | |||
| Kazerooni scoring method | GGO | PF | |
| Goldin scoring method | r | 0.653 | 0.839 |
| p | < 0.001* | < 0.001* | |
| *Statistically significant difference, p < 0.05. | |||
Correlation analyses between HRCT evaluation methods and PFTs
The staging method had a correlated positively with degree of severity of ventilatory functions and the severity staging system showed a correlated positively with degree of severity of decrease in DLCO. Both GGO score and PF score in Kazerooni scoring method had negative relation with FVC% and FEV1%. Goldin scoring method had negative relation with FVC% and DLCO% (Tables 7,8).
| Table 7: Correlation analyses between staging method/severity staging system and PFTs. | |||
| Degree of severity of ventilatory functions | Degree of severity of decrease in DLCO | ||
| Staging method | r | 0.233 | 0.083 |
| p | 0.007* | 0.373 | |
| Severity staging system | r | 0.128 | 0.260 |
| p | 0.139 | 0.005* | |
| *Statistically significant difference, p < 0.05. | |||
| Table 8: Correlation analyses between Kazerooni scoring method/Goldin scoring method and PFTs | |||||||
| PFTs | FVC% | FEV1% | FEV1/FVC | TLC% | DLCO% | ||
| Kazerooni scoring method | GGO | r | -0.236 | -0.299 | 0.244 | -0.126 | -0.183 |
| p | 0.006* | < 0.001* | 0.005* | 0.182 | 0.052 | ||
| PF | r | -0.290 | -0.178 | 0.074 | -0.310 | -0.359 | |
| p | 0.001* | 0.041* | 0.396 | 0.001* | < 0.001* | ||
| Goldin scoring method | r | -0.333 | -0.126 | 0.146 | -0.309 | -0.370 | |
| p | < 0.001* | 0.149 | 0.094 | 0.001* | < 0.001* | ||
| *Statistically significant difference, p < 0.05. | |||||||
Concordance analysis of progression evaluation between HRCT and PETs
In the study, 32 patients had completed the five–year follow up, and reviewed HRCT and PFTs more than 2 times. 12 patients showed progress in FVC, but only 5 of them had enlarged extent on HRCT compared to the baseline. 9 patients presented stable in reexamine PFTs, and 7 of them also presented stable in HRCT.
We used Fisher exact probability method to analysis the two evaluation methods, it showed no difference between HRCT and PFTs evaluation, the kappa coefficient between the two methods was 0.256 (p < 0.05), but the congruence was poor (k < 0.4) (Table 9).
| Table 9: Relation between HRCT and PFTs evaluation. | ||||
| PFTs | HRCT | p value | ||
| Improve | stable | progressive | ||
| improve | 4 | 2 | 5 | 0.084 |
| stable | 0 | 7 | 2 | |
| progressive | 2 | 5 | 5 | |
| Statistically significant difference, p < 0.05. | ||||
The etiology of systemic sclerosis is not yet clear, multiple organs can be involved. Several studies revealed that respiratory involvement include interstitial lung disease and pulmonary arterial hypertension was one of the main cause of death in SSc [14-16]. An analysis of prospectively collected data from the European League Against Rheumatism Scleroderma Trials and Research (EUSTAR) Group showed that pulmonary fibrosis attributed 35% of the SSc-related deaths [17]. Research in SSc-ILD has been paid more attention in recent years.
HRCT represents a reliable, noninvasive and repeatable tool for detecting and monitoring ILD in patients with SSc. The main HRCT findings in SSc-ILD are signs of GGO, interlobular septal thickening, intralobular septal thickening, reticular opacities; honeycombing, traction bronchiectasis and nodules can also be observed.
GGO as the most common presentation on HRCT, were hazy increased attenuation of lung, presented nodular, piece-like round or irregular shape on HRCT, with preservation of bronchial and vascular margins, mainly distributed in the lung periphery or diffusely distributed symmetrical, always suggested the early-stage or active-stage [6,7].
Cells aggregating in the interlobular septa and intralobular septa with tissue fibrosing, it leaded to irregular thread-like opacities on HRCT, which interleave with each other to forming reticular opacities, distributing in base of the lung mainly [6].
Inflammatory cell infiltration in lung tissue, lymphedema and fibrous tissue hyperplasia pulled bronchus and bronchioles resulting in irregular bronchiectasis. Traction bronchiectasis were showed thickening of the wall, expansion the lumen as dual track or irregular bag-like changes [6].
Honeycomb cysts/honeycombing referred to multi-layered cystic airspaces of typically consistent diameter (3–10 mm, but occasionally larger) with thick, well-defined walls without normal lung architecture. These lesions were irreversible and mainly distributed in the base of both lungs and under the pleura, suggesting end-stage lesions [7].
The pulmonary pathology of connective tissue disease associated interstitial lung disease is similar to idiopathic interstitial pneumonias, classify into usual interstitial ipneumonia(UIP), nonspecific interstitial pneumonia(NSIP), organizing pneumonia(OP), diffuse alveolar damage(DAD), respiratory bronchiolitis(RB), desquamative interstitial pneumonia(DIP), lymphocytic interstitial pneumonia(LIP). Patients included in this study can only see NSIP, UIP and LIP.
Histopathologically, NSIP was characterized by a uniform appearance of varying amounts of interstitial inflammation and fibrosis, and divided into cellular pattern (cNSIP) and fibrotic pattern (fNSIP). The typical finding of cNSIP was diffuse inflammatory cell infiltration without obvious fibrosis; fNSIP characterized by diffuse thickening of the alveolar walls with or without inflammatory cell infiltration [18]. On HRCT, cNSIP showed ground-glass opacities mainly, reticular opacities and traction bronchiectasis were relatively infrequent, without honeycombing; patients with fNSIP had few honeycombing, as well as greater extent of ground-glass opacities, traction bronchiectasis, and opacities than those with cNSIP [19].
The pathological feature of usual interstitial ipneumonia(UIP) was heterogeneous appearance, showing an alternate distribution of interstitial inflammation, fibrosis and normal lung tissues and can see limits scar formation with dense fibrosis, lead to the destruction and cystic formation of the pulmonary parenchyma similar to honeycomb. On HRCT imaging, UIP appeared as reticular opacities and honeycombing mainly distributed around the lung and under the pleura, with or without traction bronchiectasis [20].
The pathological characteristics of lymphocytic interstitial pneumonia (LIP) were diffuse interstitial lymphocyte infiltration and interlobular septal thickening. The feature of HRCT was the thin-walled (pellicle) cysts scattered in ground-glass opacities diffusely at both lungs [4].
Previous studies suggested that ILD patterns were associated with prognosis; UIP pattern always portended poorer prognosis than NSIP and others. ILD pattern have important implications for patient management, but lung biopsy is a seriously limiting clinical application. We compared the HRCT pattern with their pathology pattern. HRCT showed good consistency with pathology, therefore we can predict ILD pattern using HRCT rather than the invasive methods. Consistent with previous studies, the majority of SSc-ILD matched the pattern of NSIP, secondly was UIP, other patterns were rare [21,22].
Until now, there is no international general evaluation to assess ILD severity using HRCT examination, we chose two qualitative methods and two semi-quantitative score methods.
The staging method was proposed by a Chinese scholar to evaluate CTD-ILD, and divided patients into early stage, progressive stage and advanced stage. Our study suggested that reticular opacities was common in SSc-ILD, therefore more than half of the patients were grouped into stage III.
The severity staging system was a commonly used staging method, divided patients into extensive stage and limited stage. A multi-centre study from Austrilia reported that extensive stage was associated with a three-fold increased risk of deterioration or death in SSc-ILD, compared with the limited stage [23].
Kazerooni scoring method and Goldin scoring method were two semi-quantitative score methods to score the extent of the lesion with different partition and imaging.
Using the two semi-quantitative score methods to evaluate different stage by the other methods, it showed that stage III and extensive stage had higher score than the others.
We analyzed the four methods with PFTs, the results revealed that the staging method and Kazerooni scoring method can reflect the ventilatory functions, and the severity staging system and Goldin scoring method had good correlation with decrease in DLCO. DLCO was a well-accepted predictor of mortality in SSc-ILD. Whether the extent and score of lesion on HRCT associated with mortality remains to be further investigation.
Progression of CTD-ILD arouses the attention of rheumatologists. The OMERACT CTD-ILD Working Group proposed ≥ 10% relative decline in forced vital capacity (FVC) or ≥ 5% to < 10% relative decline in FVC and ≥ 15% relative decline in DLCO as the clinically meaningful progression for CTD-ILD [13]. Based on the above, we divided patients into stable group, improve group and progressive group by HRCT and PFT respectively. Some patients presented different stages in the course of five–year follow up, we used the final result comparing with baseline for division. Our study exhibited no prominent difference between HRCT and PFTs, but the congruence between HRCT and PFTs was poor. It indicates that the change of HRCT extent and physiological function of the lungs are not necessarily be synchronized.
In conclusions, SSc-ILD was characterized by diffuse GGO and pulmonary fibrosis such as interlobular septal thickening and reticular opacities on HRCT; honeycombing can also be observed in patients with advanced pulmonary fibrosis. The ILD patterns of HRCT coincide well with histology were predominantly NSIP, secondly UIP. The HRCT evaluations all showed significant relation with PFTs, and can also be used to assess progression in follow-up. A combination of both approaches to assess SSc-ILD is more holistic and comprehensive.
This article is fully funded by the National Natural Science Foundation of China with grant number: 81771734; the Medical Scientific Research Foundation of Guangdong Province of China with grant number: A2019139; the Science and Technology Program of Guangzhou, China with grant number: 201804010343.
- Mouthon L, Berezné A, Brauner M, Kambouchner M, Guillevin L, et al. Interstitial lung disease in systemic sclerosis. Presse Med. 2006; 35: 1943-1951.
- Masi AT. Preliminary criteria for the classification of systemic sclerosis (scleroderma). Arthritis Rheum. 1980; 23: 581-590. PubMed: https://pubmed.ncbi.nlm.nih.gov/7378088/
- Hoogen F, Khanna D, Fransen J, Johnson S, Sindhu R, et al. 2013 classification criteria for systemic sclerosis: an American college of rheumatology/European league against rheumatism collaborative initiative. Ann Rheum Dis. 2013; 72: 1747-1755. PubMed: https://pubmed.ncbi.nlm.nih.gov/24092682/
- Travis WD, Costabel U, Hansell DM, King TE, Lynch DA, et al. An Official American Thoracic Society/European Respiratory Society Statement: Update of the International Multidisciplinary Classification of the Idiopathic Interstitial Pneumonias. Am J Respir Crit Care Med. 2013; 188: 733-748. PubMed: https://pubmed.ncbi.nlm.nih.gov/24032382/
- Raghu G, Collard HR, Egan JJ, Martinez FJ, Behr J, et al. An official ATS/ERS/JRS/ALAT statement: idiopathic pulmonary fibrosis: evidence-based guidelines for diagnosis and management. Am J Respir Crit Care Medi. 2011; 183: 788-824. PubMed: https://pubmed.ncbi.nlm.nih.gov/21471066/
- Yamanaka Y , Baba T , Hagiwara E, Yanagawa N, Takemura T, et al. Radiological images of interstitial pneumonia in mixed connective tissue disease compared with scleroderma and polymyositis/dermatomyositis. Eur J Radiol. 2018; 107: 26-32. PubMed: https://pubmed.ncbi.nlm.nih.gov/30292269/
- Austin JH, Müller NL, Friedman PJ, Hansell DM, Naidich DP, et al. Glossary of terms for CT of the lungs: recommendations of the Nomenclature Committee of the Fleischner Society. Radiology. 1996; 200: 327-331. PubMed: https://pubmed.ncbi.nlm.nih.gov/8685321/
- Qiu JG, Pan JP, Yu SB, Xing W, et al. Clinical Value of HRCT in Staging Lung Interstitial in Connective Tissue Disease. J Pract Radiol. 2008: 41--46.
- Goh NSL, Desai SR, Veeraraghavan S, Hansell DM, Copley SJ, et al. Interstitial Lung Disease in Systemic Sclerosis. Semin Respir Crit Care Med. 2008; 35: 213-221.
- Kazerooni EA, Martinez FJ, Flint A, Jamadar DA, Toews G. Thin-section CT obtained at 10-mm increments versus limited three-level thin-section CT for idiopathic pulmonary fibrosis: correlation with pathologic scoring. Ajr Am J Roentgenol. 1997; 169: 977-983. PubMed: https://pubmed.ncbi.nlm.nih.gov/9308447/
- Goldin JG, Lynch DA , Strollo DC, Suh RD, Schraufnagel DE, et al. High-Resolution CT Scan Findings in Patients With Symptomatic Scleroderma-Related Interstitial Lung Disease. Chest. 2008, 134: 358-367. PubMed: https://pubmed.ncbi.nlm.nih.gov/18641099/
- Pellegrino R, Viegi G, Brusasco V, Carpo RO, Brgos F, et al. Interpretative strategies for lung function tests. Eur Respir J. 2005; 26: 948-968. PubMed: https://pubmed.ncbi.nlm.nih.gov/16264058/
- Khanna D, Mittoo S, Aggarwal R, Proudman S, Susanna M, et al. Connective Tissue Disease-associated Interstitial Lung Diseases (CTD-ILD) -- Report from OMERACT CTD-ILD Working Group. J Rheumatol. 2015; 42: 2168-2171.. PubMed: https://pubmed.ncbi.nlm.nih.gov/25729034/
- Steen VD, Medsger TA. Changes in causes of death in systemic sclerosis, 1972–2002. Ann Rheum Dis. 2007; 66: 940-944. PubMed: https://pubmed.ncbi.nlm.nih.gov/17329309/
- Simeon CP, Armadans L, Fonollosa V, Solans R, Selva A, et al. Mortality and prognostic factors in Spanish patients with systemic sclerosis. Rheumatology(Oxford). 2003; 42: 71-75. PubMed: https://pubmed.ncbi.nlm.nih.gov/12509616/
- Sampaio-Barros PD, Bortoluzzo AB, Marangoni RG, Rocha LF, Del Rio APT, et al. Survival, Causes of Death, and Prognostic Factors in Systemic Sclerosis: Analysis of 947 Brazilian Patients. J Rheumatol. 2012; 39: 1971-1978. PubMed: https://pubmed.ncbi.nlm.nih.gov/22896025/
- Tyndall AJ, Bannert B, Vonk M, Airo P, Cozzi F, et al. Causes and risk factors for death in systemic sclerosis: a study from the EULAR Scleroderma Trials and Research (EUSTAR) database. Ann Rheum Dis. 2010; 69: 1809-1815. PubMed: https://pubmed.ncbi.nlm.nih.gov/20551155/
- Travis WD, Hunninghake G, King TE, David A, Colby TV, et al. Idiopathic nonspecific interstitial pneumonia: report of an American Thoracic Society project. Am J Respir Crit Care Med. 2008; 177: 1338-1347. PubMed: https://pubmed.ncbi.nlm.nih.gov/18388353/
- Johkoh T, Muller NL, Colby TV, Ichikado K, Taniguchi H, et al. Nonspecific Interstitial Pneumonia: Correlation between Thin-Section CT Findings and Pathologic Subgroups in 55 Patients. Radiology. 2002; 225: 199-204. PubMed: https://pubmed.ncbi.nlm.nih.gov/12355005/
- Raghu G, Remy-Jardin M, Myers JL, Richeldi L, Ryerson CJ, er al. Diagnosis of Idiopathic Pulmonary Fibrosis An Official ATS/ERS/JRS/ALAT Clinical Practice Guideline.Am J Respir Crit Care Med. 2018; 198: e44-68. PubMed: https://pubmed.ncbi.nlm.nih.gov/30168753/
- Yamanaka Y, Baba T, Hagiwara E, Yanagawa N, Takemura T, et al. Radiological Images of Interstitial Pneumonia in Mixed Connective Tissue Disease Compared with Scleroderma and Polymyositis/Dermatomyositis. Eur J Radiol. 2018; 107: 26-32. PubMed: https://pubmed.ncbi.nlm.nih.gov/30292269/
- Das A, Kumar A, Arrossi AV, Ghosh S, Highland KB. Scleroderma-related interstitial lung disease: principles of management. Expert Rev Respir Med. 2019; 13: 357-367. PubMed: https://pubmed.ncbi.nlm.nih.gov/30686069/
- Moore OA, Goh N, Corte T, Rouse H, Hennessy O, et al. Extent of disease on high-resolution computed tomography lung is a predictor of decline and mortality in systemic sclerosis-related interstitial lung disease. Rheumatology (Oxford). 2013,52: 155-160. PubMed: https://pubmed.ncbi.nlm.nih.gov/23065360/