
More Information
Submitted: September 01, 2023 | Approved: September 19, 2023 | Published: September 20, 2023
How to cite this article: Valenzuela RF, Amini B, Duran-Sierra E, Canjirathinkal MA, Madewell JE, et al. Multiparametric MRI for the Assessment of Treatment Effect and Tumor Recurrence in Soft-tissue Sarcoma of the Extremities. J Radiol Oncol. 2023; 7: 058-065.
DOI: 10.29328/journal.jro.1001055
Copyright License: © 2023 Valenzuela RF, et al. This is an open access article distributed under the Creative Commons Attribution License, which permits unrestricted use, distribution, and reproduction in any medium, provided the original work is properly cited.
Keywords: Soft-Tissue Sarcoma (STS); Multiparametric MRI; Treatment Induced Necrosis (TIN); Susceptibility-Imaging (SWI); Perfusion-Imaging (PWI); Diffusion-Imaging (DWI)
Abbreviated title: ADC: Apparent Diffusion Coefficient; DCE: Dynamic Contrast-Enhanced; DWI: Diffusion-Weighted Imaging; MRI: Magnetic Resonance Imaging; SWI: Susceptibility-Weighted Imaging; TIC: Time-Intensity Curve; TIN: Treatment-Induced Necrosis; UPS: Undifferentiated Pleomorphic Sarcoma; VOI: The Volume of Interest

Multiparametric MRI for the Assessment of Treatment Effect and Tumor Recurrence in Soft-tissue Sarcoma of the Extremities
Raul F Valenzuela*, Behrang Amini, Elvis Duran-Sierra, MA Canjirathinkal, John E Madewell, Colleen M Costelloe and William A Murphy
Department of Musculoskeletal Imaging, University of Texas MD Anderson Cancer Center, Houston, Texas, USA
*Address for Correspondence: Raul F Valenzuela, MD, Assistant Professor, Department of Musculoskeletal Imaging, University of Texas MD Anderson Cancer Center, Houston, Texas, USA, Email: [email protected]
Soft-tissue sarcomas are a rare and complex group of malignant tumors. Advanced MRI sequences such as diffusion-weighted imaging (DWI) and perfusion-weighted imaging/dynamic contrast enhancement (PWI/DCE) can provide valuable tumor characterization and treatment response assessment. In the case of archetypical cellular tumors such as Pleomorphic Undifferentiated sarcoma (UPS), Good responders often display right-side displacement of the ADC intensity histogram, resulting in increased ADC-mean and decreased kurtosis and Skewness compared with Baseline and poor responders’ more left-sided curve. The PWI/DCE pattern most often associated with a good response is the presence of a “capsular-like” enhancement and a TIC type 2. Sarcoma hemorrhage patterns on SWI emerge during treatment, including “interstitial,” globular,” “luminal,” and incomplete and complete “peripheral ring-like” tumor wall hemosiderin impregnation. Treatment-induced bleeding is typically associated with low SWI-mean values and a left-sided intensity histogram with positive Skewness.
During post-surgical surveillance, DCE MR imaging can reliably distinguish recurrent sarcoma from post-surgical scarring. TICs III, IV, and V raise the suspicion of local tumor recurrence, while TIC type II usually represents benign post-operative change such as granulation tissue. Advanced MRI is an essential tool for assessing sarcomas during and after therapy.
Soft tissue sarcomas are a heterogeneous group of malignant tumors. Several subgroups are known, including Adipocytic, Fibroblastic/myofibroblastic, So-called fibro-histiocytic, Vascular, Pericytic (perivascular), Skeletal muscle, Smooth muscle, Gastrointestinal stroma, Chondro-osseous, Peripheral nerve sheath, Uncertain differentiation, and Undifferentiated small round cell Sarcomas [1].
Undifferentiated pleomorphic sarcomas (UPS) are the largest subgroup of soft tissue sarcomas, accounting for approximately 20% of all cases. The present article’s STS description is primarily UPS-based, presenting it as an archetypical cellular soft-tissue sarcoma tumor model that is significantly different from the ones observed on other primary myxoid, chondroid, lipomatous, or fibrous-rich STS. UPS is diagnosed when all other identifiable lines of histopathologic differentiation have been excluded. Histopathologically, undifferentiated STS can be divided into four genetic subgroups, with pleomorphic tumors being the most common. They can occur anywhere in the body and at any age; although pleomorphic tumors are more common in older patients, round-cell tumors occur more frequently in younger individuals [2].
The heterogeneity of high-grade soft tissue sarcomas is reflected in the MRI signal characteristics of the lesions. Advanced MRI sequences, such as diffusion-weighted and dynamic contrast-enhanced imaging, are advantageous when successfully treated tumors form alternate tissue types, such as fibrosis and granulation tissue, rather than necrosis [3,4].
Post-therapeutic assessment
Post-therapeutically, these tumors may demonstrate hemosiderin deposition, granulation tissue formation, fibrosis, and calcification. After undergoing chemotherapy or radiation therapy, assessing the response of soft-tissue tumors (STS) can be challenging because most treated STS contains a combination of different cells, such as tumor cells, necrosis, and hemorrhage. Furthermore, viable tumor cells can be replaced with benign tissue rather than undergoing necrosis, which makes it difficult to determine if the tumor has decreased, increased in size, or remained the same. Response criteria such as the Response Evaluation Criteria in Solid Tumors (RECIST) require a significant reduction in tumor size to be considered a positive response. The modified Choi criteria have been designed specifically for soft-tissue tumors and allow for a partial response with a decrease in size or attenuation of 10% or 15%, respectively. Other metrics have been studied to assess tumor response and prognosis.
Most STS patients receive systemic therapy with anthracyclines and alkylating agents [5]. Radiation therapy may also be administered before or after surgery. Early indicators of tumor susceptibility to treatment can help identify effective agents and stop ineffective ones. High post-therapeutic tumor necrosis (TIN) is a robust prognostic indicator in some sarcomas. Increased histologic necrosis may lead to higher rates of R0 resection and facilitate limb salvage in unresectable tumors due to neurovascular encasement or truncal involvement [3,6].
Pseudo progression
According to the literature, pseudoprogression is a phenomenon where a tumor enlarges from the therapeutic Baseline, followed by radiologic regression without change in therapy and an indication of progression on subsequent imaging or pathologic assessment. This can occur in up to 10% of STS Good Responders and 30% of patients with an intermediate response. Furthermore, tumor volume may increase in size by up to 40% after radiation. A pilot study by Fields et al. found that some cases displayed increased volume despite 95% tumor necrosis [7].
From our experience, pseudo-progression is commonly observed in Good Responders. It may demonstrate a volume increase of up to 60% at Post Chemotherapy and 90% at Post-Radiation, both in the range of disease progression by RECIST, even in patients with the most significant response, with more than 90% of treatment-induced necrosis (TIN) (Figure 1).
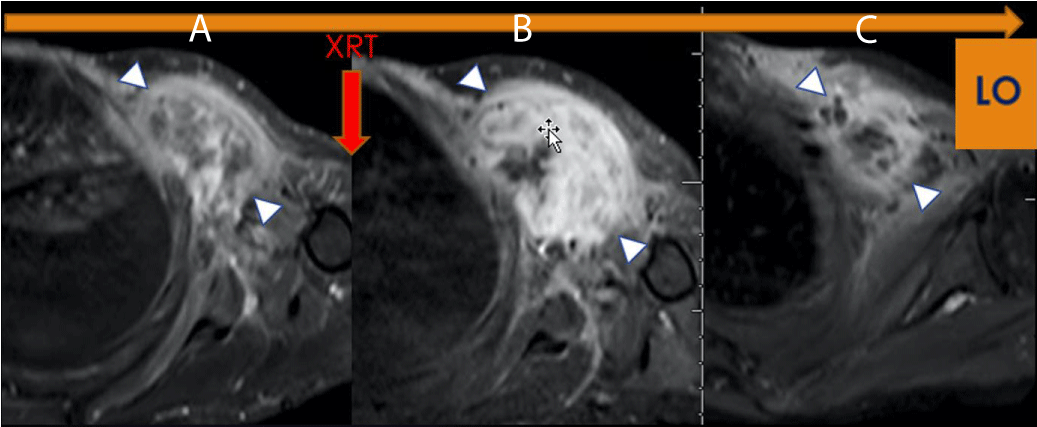
Figure 1: LO (Learning Objective): Pseudo progression due to Radiation Therapy. Axial FS T1 post-contrast imaging of the left shoulder demonstrates (A) a Pre-therapeutic tumor, (B) an increase in the size and enhancement of the tumor, (C) Without additional therapy, there has been a decrease in size and enhancement indicating pseudoprogression on Figure 1b (arrowhead). The histologic specimen demonstrated 95% necrosis, combined with granulation tissue and no viable tumor.
Multiparametric assessment of soft-tissue sarcoma
Our institution routinely utilizes multiparametric MRI for the study of extremity tumors, particularly Soft-Tissue sarcomas (STS), including Diffusion Imaging (DWI/ADC), Perfusion Imaging (PWI/DCE), and Contrast-enhances Susceptibility Imaging (CE-SWI). The entire study typically lasts less than 40 minutes on average. For STS, we usually conduct a pre-therapy Baseline study, one to three MRIs during systemic therapy, and one post-radiation analysis within two to three months of radiation therapy and before surgical resection. This comprehensive approach allows us to provide a reliable assessment of Treatment-Induced Necrosis (TIN) as a measure of treatment effectiveness.
Diffusion-Imaging (DWI)
Diffusion-weighted imaging (DWI) is an MRI sequence that measures the density of tumor cells. DWI uses the movement of water molecules to determine the cellularity of malignancies, which have fewer extracellular spaces and smaller cytoplasm than normal tissues. The restricted diffusion in malignancies results in lower ADC values, which can help distinguish them from benign lesions (Figure 2). Effective therapy resulting in cell death increases water diffusion, reflected in higher ADC values. ADC values are inversely correlated with the Ki67 labeling index, indicating a lower mean in higher proliferation groups [8,9]. DWI has also been shown to be a valuable biomarker for response assessment in sarcoma patients treated with preoperative radiation therapy. Changes at the cellular level occur before morphologic changes, making DWI a potential prognostic tool if performed early in treatment [10-14]. Not only ADC mean but also minimum ADC values are considerably higher in good responders (> 90% of necrosis by histological examination) than in poor responders [12].
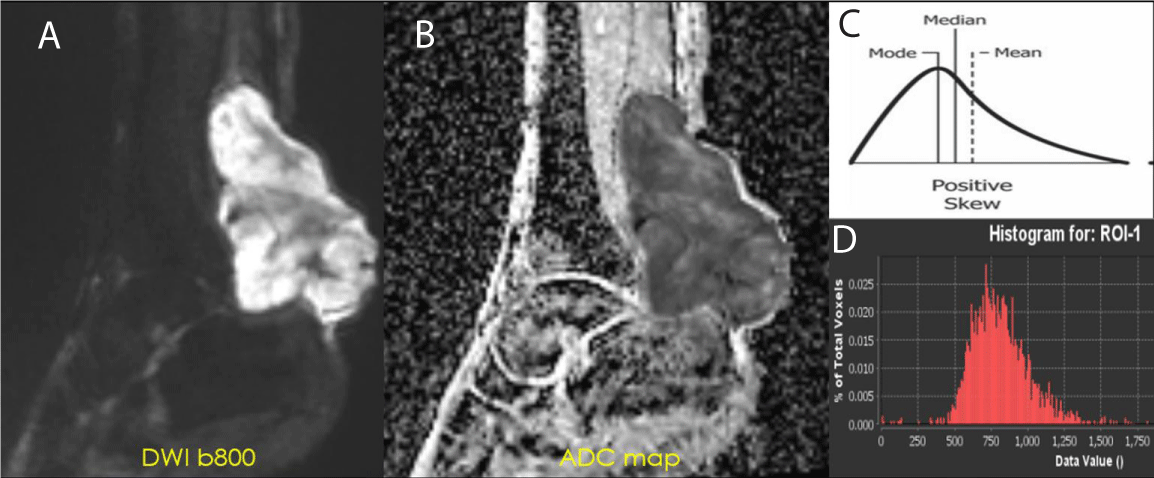
Figure 2: ADC of Cellular STS - High-grade UPS: (A) DWI b800 demonstrating high signal intensity within the posterior left ankle tumor. (B) ADC map displaying a value of 0.8 x 10⁻³ mm2/s. This value is within the accepted range of restricted diffusion for cellular soft tissue sarcoma (0.7-1.1 x 10⁻³ mm2/s) (C-D) Intensity histogram curve demonstrates low ADC with Positive Skew (left-sided intensity histogram curve).
In our experience, good responders tend to have a lower baseline ADC mean and the highest percentage of increase at post-radiation MRI, often in the range of 40% [13] (Figure 3).
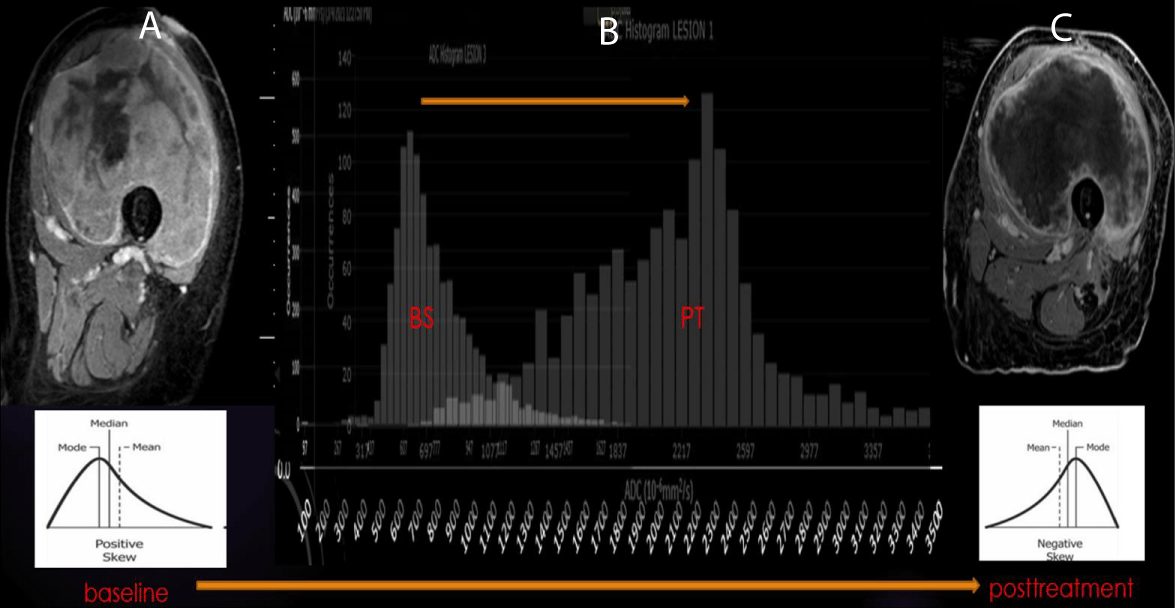
Figure 3: ADC of Good Response in UPS: (A-B) Pretherapeutic contrast-enhanced MRI of the left thigh with a predominance of solid internal enhancement, associated with a left-sided ADC histogram (positive Skewness). (B-C) Post-therapeutic contrast-enhanced MRI demonstrating markedly diminished sold enhancement and a right-sided ADC histogram (negative Skewness).
When examining STS ADC maps, it’s essential to keep in mind that tumoral bleeding can cause low ADC values due to susceptibility-related T2* shortening, which can affect the signal intensity on DWI. This phenomenon can lead to equivocal interpretations of STS features when restricted diffusion is present alongside blood, melanin, high-protein content, and iron, as these substances may cause nontumoral restricted diffusion. It’s important to note that intra-tumoral hemorrhage, often seen in high-grade soft-tissue tumors, can worsen in the context of successful therapy with a high degree of TIN, which can impede the expected rise of ADC resulting from the treatment-induced reduction of cellularity [14].
Perfusion Imaging with Dynamic Contrast Enhancement (PWI/DCE)
Dynamic contrast MRI involves a series of rapid scans through the tumor following intravenous contrast administration and assesses tissue perfusion kinetics over time. Dynamic contrast MRI (DCE) is a valuable technique for determining tissue perfusion kinetics and identifying viable malignant tissue in tumors over time.
Malignant tissues typically show rapid early enhancement compared to benign tumors; DCE can differentiate between malignant and benign by identifying their different perfusion patterns tissue. This technique is valuable for biopsy navigation and identifying post-therapeutic histologic changes [8,15]. Although there is contradicting published information regarding its value in distinguishing benign from malignant tumors, DCE combined with DWI has been found to increase diagnostic accuracy for identifying therapeutic responses compared to conventional, static post-contrast imaging alone.
Advanced imaging can identify post-therapeutic histologic changes, such as the development of granulation tissue and fibrosis, that could otherwise be indistinguishable from the viable tumor in conventional imaging [16, 17]. In our experience, particularly with Undifferentiated Pleomorphic Sarcomas, the PWI/DCE pattern most often associated with a good response is a “capsular-like” enhancement and a TIC type 2. Kinetic curve V and “unipolar” and “bipolar” enhancement patterns are often associated with partial and non-responders.
Susceptibility-Weighted Imaging (SWI)
SWI is a 3D high-spatial-resolution, velocity-corrected gradient-echo MRI sequence that uses magnitude and filtered-phase information to create images. It uses tissue magnetic susceptibility differences to generate signal contrast. Such signal arises from paramagnetic (hemosiderin), diamagnetic (minerals and calcifications), and ferromagnetic (metal) molecules, resulting in loss of signal. Susceptibility-weighted imaging (SWI) is a powerful MRI technique that uses tissue magnetic susceptibility differences to create images with high spatial resolution. This technique can detect various susceptibility effects, including the T2* susceptibility effect, T2 signal, and out-of-phase fat and water effect. The combined use of SWI and intravenous paramagnetic contrast: Contrast-Enhanced SWI (CE-SWI) has been used in neuroradiology to characterize intracranial tumors [18]. Postcontrast SWI images demonstrate a bright rim of enhancement surrounding intracranial parenchymal (intra-axial) tumors such as lymphoma [19].
The novel use of SWI in MSK oncologic imaging can be especially useful, as it can help to differentiate between benign and malignant soft tissue tumors, as higher-grade tumors tend to have spontaneous central hemorrhage patterns. In our institution, we have explored the use of Contrast-Enhanced SWI (CE-SWI), where susceptibility (T2*) and T1 shortening sensitivity are combined during CE-SWI sequences. In soft tissue tumors, this sequence can demonstrate the viable, T1-shortening enhancing portions of a soft tissue sarcoma separately from T2* hypointense hemorrhagic/necrotic components, suggesting its utility as an indicator for evaluating treatment response. Early results have also helped to separate immature enhancing from T2 hypointense mature collagenized desmoid tumor components [20].
During treatment for sarcoma, hemorrhage patterns can appear on SWI. These patterns include “interstitial,” “globular,” “luminal,” and incomplete and complete “peripheral ring-like” tumor wall hemosiderin impregnation. If bleeding occurs, it is typically associated with low SWI-mean values and a left-sided intensity histogram with positive Skewness. Our experience has shown that a complete T2* hypointense ring is a typical SWI morphologic pattern observed in the good responder group [21-24] (Figure 4). The CE-SWI sequence provides additional and valuable information and typically adds no more than an additional 4-5 minutes to the MRI exam. As a result, it has become a structural sequence of our routine extremity tumor MRI protocol [25,26].
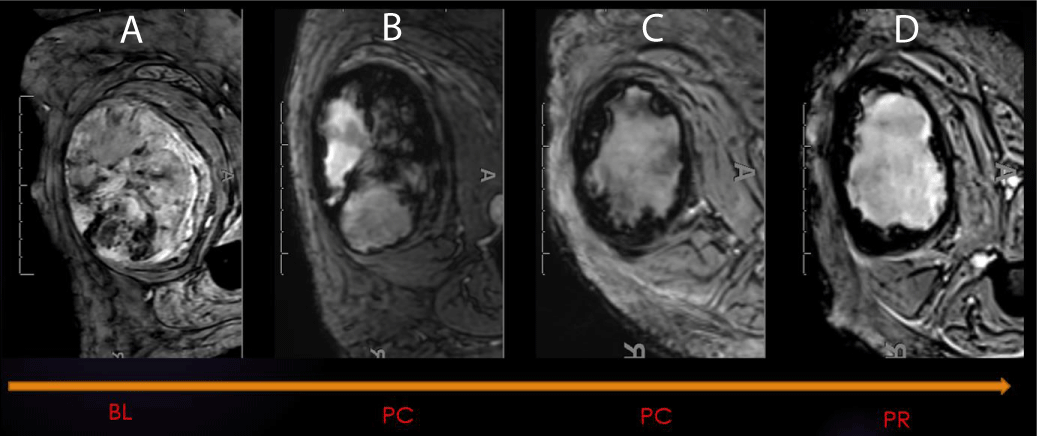
Figure 4: SWI: Hemorrhage as a Biomarker of Response. SWI of right thigh demonstrating an undifferentiated pleomorphic sarcoma (UPS) at different stages during therapy (A-Baseline, B-Post-chemo initial, C-post chemo final, D-Post-radiation). 99% necrosis on the histologic specimen.
Post-surgical surveillance and tumor recurrence
After undergoing radical resection for soft tissue sarcoma, the patient undergoes regular MRI surveillance to monitor for recurrence. Published Tumor recurrence can be as high as 40% [27]. At our institution, the recurrence rate is in the range of 10% of cases. The surveillance schedule typically includes MR scans every 3 months for the first 2 years, followed by scans every 4 months for 3 to 4 years, every 6 months for 4 to 5 years, and annually for 5 to 10 years.
Adding functional MR sequences, such as DCE MR imaging, to the standard MR protocol is recommended to improve the accuracy of detecting recurrent tumors further. This technique has a specificity of over 95% for distinguishing between recurrent sarcoma and post-surgical scarring. TICs III, IV, and V are highly suspicious for local tumor recurrence and require a confirmatory percutaneous biopsy, while TIC type II usually represents benign post-operative changes [28-30]. In our experience, DCE MR imaging can reliably distinguish recurrent sarcoma from post-surgical scarring. TICs III, IV, and V raise the suspicion of local tumor recurrence, while TIC type II usually represents benign post-operative change such as granulation tissue (Figure 5).
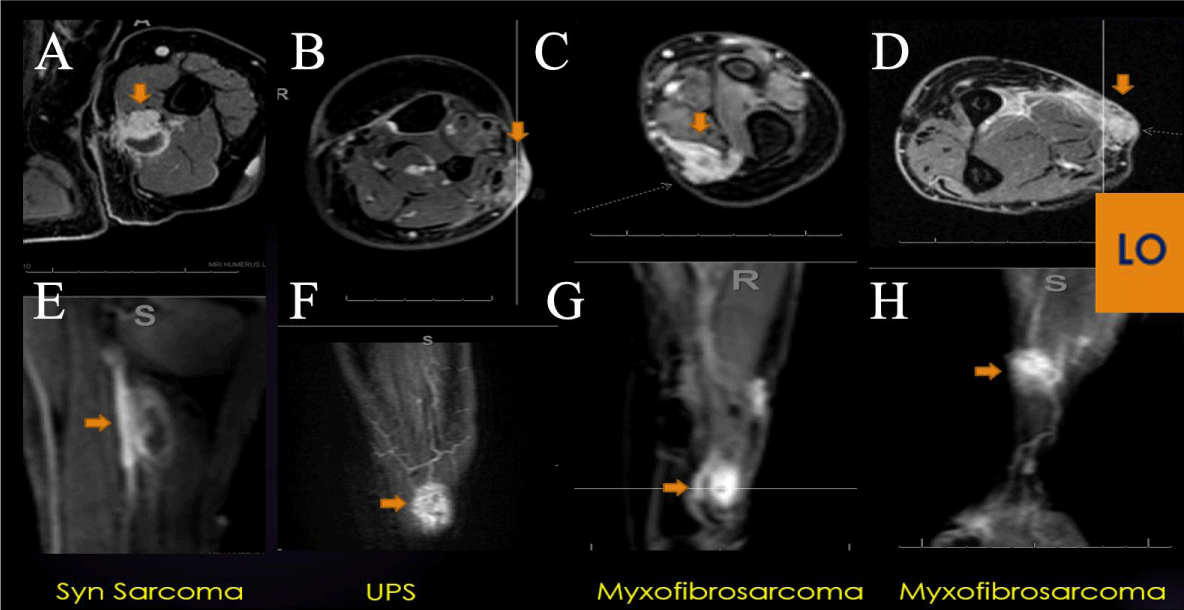
Figure 5: LO (Learning Objective): Recurrent Soft Tissue Sarcoma on PWI: Four examples of extremity recurrent STS demonstrating nodular enhancement on conventional post-contrast axial imaging (A-D) and early arterial nodular enhancement on PWI (E-H), often displaying a Type V TIC. DCE can be a valuable tool in the surveillance for recurrent cellular STS, often displaying a Type V TIC.
As cancer treatment continues to advance, more targeted therapies are available that can increase the lifespan of patients, even without reducing the tumor size. In light of this, new metrics are being developed that focus on more accurate indicators of tumor behavior beyond just its size. For example, DWI and PWI imaging techniques are becoming increasingly relevant because they can help resolve common diagnostic dilemmas. These techniques can differentiate between tumor expansion due to post-therapeutic necrosis and disease progression or identify granulation tissue from recurrent tumors. By combining these new functional modalities with traditional anatomic evaluations, healthcare providers can improve their ability to assess therapeutic responses and better care for cancer patients [5].
Traditional response criteria such as RECIST rely on physical measurements, but tumor diameter does not always reflect response. Volumetric pseudo-progression can be a helpful indicator of high treatment-induced necrosis. Functional imaging techniques like DWI and PWI/DCE can also provide valuable information on tumor characterization and treatment response. Various hemorrhage patterns on SWI during treatment are observed.
DWI can show the level of tumor cellularity, which helps distinguish between benign and malignant tumors. It can also be used to assess treatment response. On the other hand, PWI, specifically dynamic contrast-enhanced (DCE) perfusion with dynamic gadolinium injection and enhancement time-intensity curve analysis and tumor kinetics assessment, has proven useful in evaluating treatment response. This technique has an advantage in cases where response underestimation may occur using size-based traditional evaluation [31]. Perfusion MRI and diffusion/apparent diffusion coefficient (ADC) mapping can help identify good responders to chemotherapy early. Perfusion MRI and Diffusion MRI can be incorporated into routine imaging protocols, increasing diagnostic accuracy for the initial and post-therapeutic assessment of STS [5] (Figure 6).
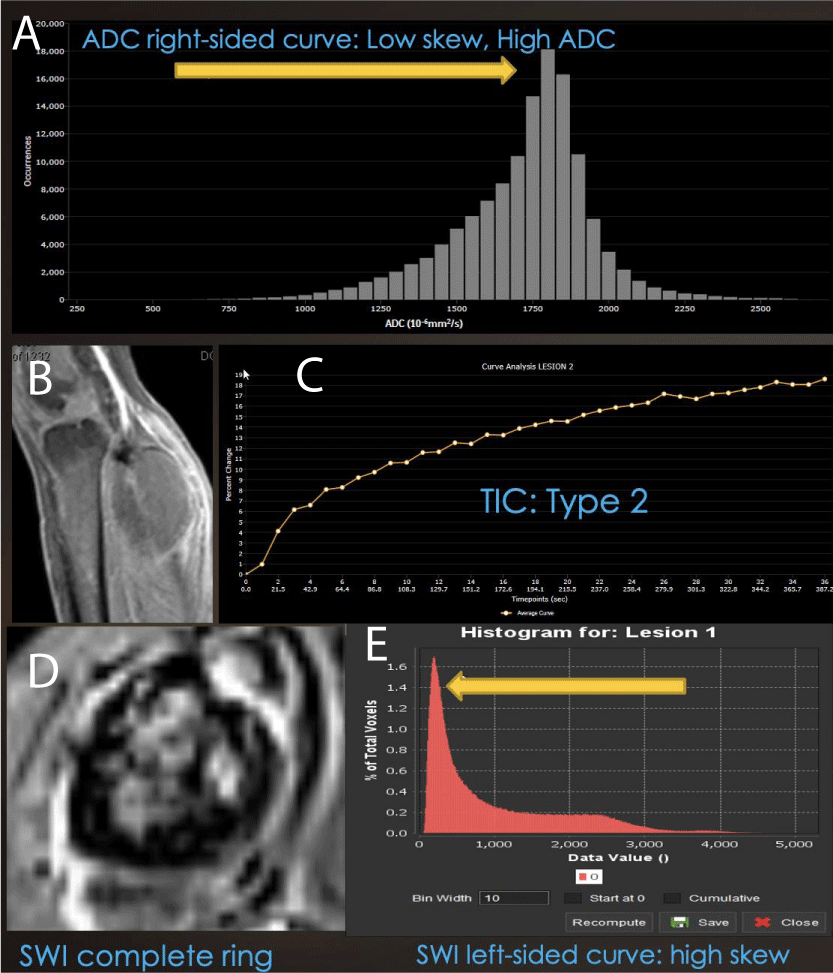
Figure 6: Combined Modality Model of Good Therapeutic Response: (A) Right-sided displacement of ADC histogram, (B) low-grade rim PWI arterial enhancement, (C) Type II TIC on DCE and (D) ring-like hemosiderin SWI pattern with (E) left-sided SWI histogram displacement is seen in successfully treated cellular sarcomas, while non-responding cases often have an incomplete ring, Type III, IV or V TIC, with unipolar or bipolar enhancement.
In our experience, SWI is a valuable biomarker for tumor treatment response. Its ability to display hemorrhage in soft tissue lesions and distinguish viable, enhancing portions of soft tissue sarcoma from hemorrhagic or necrotic components has become a valuable tool in assessing treatment-induced tumor changes. The novel use of Contrast-enhanced SWI (CE-SWI) in STS assessment has made it possible to identify the viable, T1-shortening enhancing parts of a soft tissue sarcoma separately from T2* hypointense hemorrhagic/necrotic components, making it an excellent indicator for the evaluation of treatment response. The presence of a complete T2* peripheral hypointense ring is a common SWI morphologic pattern observed in the good responder group. This innovative use of CE-SWI has the potential to be a powerful imaging tool in assessing TIN and overall treatment response, to be considered as part of a multiparametric STS baseline and treatment evaluation.
Recommendation
Conducting routine multiparametric MRI for STS baseline and treatment evaluation using DWI, PWI, and SWI can provide valuable biological information regarding intrinsic tumor and treatment-induced changes. These changes may not be easily detectable using size-based metrics like RECIST and WHO; therefore, we find these alternative methods necessary, which is why they are part of our routine Extremity Sarcoma MRI protocol.
Based on our experience, performing MRI with PWI/DCE imaging during routine post-surgical surveillance is an effective method for differentiating between recurrent sarcoma and post-surgical scarring. TICs III, IV, and V indicate possible local tumor recurrence, while TIC type II typically indicates benign post-operative changes, such as granulation tissue. Due to its high predictive value, analyzing PWI/DCE is critical in evaluating tumor recurrence, especially for archetypical cellular and some myxoid STS. However, it may be less valuable in assessing the recurrence of lipomatous or chondroid types of STS.
In our experience, a combination of post-radiation volumetric pseudoprogression, “ring-like” T2* hypo intensity on CE-SWI, and “capsular-like” PWI/DCE enhancement with Type II TIC, a right-side displacement of the ADC intensity histogram with an increased ADC mean of more than 40% since the Baseline, and a significant SWI-mean decrease /Skewness increase at post-chemotherapy is often seen in successfully treated non-myxoid UPS with > 90% treatment-induced necrosis (TIN).
At the same time, suboptimal responders often display an incomplete ring on SWI, unipolar or bipolar enhancement on PWI, and TIC III, IV, or V.
During post-surgical routine surveillance MRI, DCE MR imaging can reliably distinguish recurrent sarcoma from post-surgical scarring. TICs III, IV, and V raise the suspicion of local tumor recurrence, while TIC type II usually represents benign post-operative change such as granulation tissue.
Multiparametric MRI, including DWI/ADC, PWI/DCE, and CE-SWI, can be a powerful method for assessing sarcomas during and after therapy, often outperforming traditional size-based tumor metrics and conventional MRI.
The John S. Dunn, Sr. Distinguished Chair in Diagnostic Imaging.
M.R Evelyn Hudson Foundation Endowed Professorship.
- Sbaraglia M, Bellan E, Dei Tos AP. The 2020 WHO Classification of Soft Tissue Tumours: news and perspectives. Pathologica. 2021 Apr;113(2):70-84. doi: 10.32074/1591-951X-213. Epub 2020 Nov 3. PMID: 33179614; PMCID: PMC8167394.
- WHO classification of tumours of soft tissue and bone. 4th edition / edited by Fletcher CDM. et al. 236-238
- Soldatos T, Ahlawat S, Montgomery E, Chalian M, Jacobs MA, Fayad LM. Multiparametric Assessment of Treatment Response in High-Grade Soft-Tissue Sarcomas with Anatomic and Functional MR Imaging Sequences. Radiology. 2016 Mar;278(3):831-40. doi: 10.1148/radiol.2015142463. Epub 2015 Sep 21. PMID: 26390048; PMCID: PMC4770945.
- Crombé A, Marcellin PJ, Buy X, Stoeckle E, Brouste V, Italiano A, Le Loarer F, Kind M. Soft-Tissue Sarcomas: Assessment of MRI Features Correlating with Histologic Grade and Patient Outcome. Radiology. 2019 Jun;291(3):710-721. doi: 10.1148/radiol.2019181659. Epub 2019 Apr 9. PMID: 30964422.
- Valenzuela RF, Kundra V, Madewell JE, Costelloe CM. Advanced Imaging in Musculoskeletal Oncology: Moving Away From RECIST and Embracing Advanced Bone and Soft Tissue Tumor Imaging (ABASTI) - Part I - Tumor Response Criteria and Established Functional Imaging Techniques. Semin Ultrasound CT MR. 2021 Apr;42(2):201-214. doi: 10.1053/j.sult.2020.08.012. Epub 2020 Aug 29. PMID: 33814106.
- Tsagozis P, Brosjö O, Skorpil M. Preoperative radiotherapy of soft-tissue sarcomas: surgical and radiologic parameters associated with local control and survival. Clin Sarcoma Res. 2018 Oct 5;8:19. doi: 10.1186/s13569-018-0106-x. PMID: 30323920; PMCID: PMC6172791.
- Fields BKK, Hwang D, Cen S, Desai B, Gulati M, Hu J, Duddalwar V, Varghese B, Matcuk GR Jr. Quantitative magnetic resonance imaging (q-MRI) for the assessment of soft-tissue sarcoma treatment response: a narrative case review of technique development. Clin Imaging. 2020 Jul;63:83-93. doi: 10.1016/j.clinimag.2020.02.016. Epub 2020 Feb 28. PMID: 32163847.
- Subhawong TK, Wilky BA. Value added: functional MR imaging in management of bone and soft tissue sarcomas. Curr Opin Oncol. 2015 Jul;27(4):323-31. doi: 10.1097/CCO.0000000000000199. PMID: 26049272.
- Lee JH, Yoon YC, Seo SW, Choi YL, Kim HS. Soft tissue sarcoma: DWI and DCE-MRI parameters correlate with Ki-67 labeling index. Eur Radiol. 2020 Feb;30(2):914-924. doi: 10.1007/s00330-019-06445-9. Epub 2019 Oct 18. PMID: 31630234.
- Dudeck O, Zeile M, Pink D, Pech M, Tunn PU, Reichardt P, Ludwig WD, Hamm B. Diffusion-weighted magnetic resonance imaging allows monitoring of anticancer treatment effects in patients with soft-tissue sarcomas. J Magn Reson Imaging. 2008 May;27(5):1109-13. doi: 10.1002/jmri.21358. PMID: 18425832.
- Winfield JM, Miah AB, Strauss D, Thway K, Collins DJ, deSouza NM, Leach MO, Morgan VA, Giles SL, Moskovic E, Hayes A, Smith M, Zaidi SH, Henderson D, Messiou C. Utility of Multi-Parametric Quantitative Magnetic Resonance Imaging for Characterization and Radiotherapy Response Assessment in Soft-Tissue Sarcomas and Correlation With Histopathology. Front Oncol. 2019 Apr 25;9:280. doi: 10.3389/fonc.2019.00280. PMID: 31106141; PMCID: PMC6494941.
- Drapé JL. Advances in magnetic resonance imaging of musculoskeletal tumours. Orthop Traumatol Surg Res. 2013 Feb;99(1 Suppl):S115-23. doi: 10.1016/j.otsr.2012.12.005. Epub 2013 Feb 4. PMID: 23380432.
- Duran-Sierra E, Valenzuela RF, Canjirathinkal M, Murphy W, Madewell J, Costelloe C, Amini B. Apparent Diffusion Coefficient (ADC) High-Order Radiomics of Baseline and Post-treatment Advanced MRI of extremity Soft-Tissue Undifferentiated Pleomorphic Sarcoma. https://dx.doi.org/10.26044/ecr2023/C-20144
- Lall C, Bura V, Lee TK, Bhosale P, Faria SC, Choi JI, Wang ZJ. Diffusion-weighted imaging in hemorrhagic abdominal and pelvic lesions: restricted diffusion can mimic malignancy. Abdom Radiol (NY). 2018 Jul;43(7):1772-1784. doi: 10.1007/s00261-017-1366-2. PMID: 29110051.
- Noebauer-Huhmann IM, Amann G, Krssak M, Panotopoulos J, Szomolanyi P, Weber M, Czerny C, Breitenseher M, Grabner G, Bogner W, Nemec S, Dominkus M, Funovics P, Windhager R, Trattnig S. Use of diagnostic dynamic contrast-enhanced (DCE)-MRI for targeting of soft tissue tumour biopsies at 3T: preliminary results. Eur Radiol. 2015 Jul;25(7):2041-8. doi: 10.1007/s00330-014-3576-0. Epub 2015 Jan 11. PMID: 25577522.
- Leplat C, Hossu G, Chen B, De Verbizier J, Beaumont M, Blum A, Gondim Teixeira PA. Contrast-Enhanced 3-T Perfusion MRI With Quantitative Analysis for the Characterization of Musculoskeletal Tumors: Is It Worth the Trouble? AJR Am J Roentgenol. 2018 Nov;211(5):1092-1098. doi: 10.2214/AJR.18.19618. Epub 2018 Sep 21. PMID: 30240289.
- Lee SK, Jee WH, Jung CK, Chung YG. Multiparametric quantitative analysis of tumor perfusion and diffusion with 3T MRI: differentiation between benign and malignant soft tissue tumors. Br J Radiol. 2020 Nov 1;93(1115):20191035. doi: 10.1259/bjr.20191035. Epub 2020 Oct 1. PMID: 32649224; PMCID: PMC8519635.
- Sparacia G, Speciale C, Banco A, Bencivinni F, Midiri M. Accuracy of SWI sequences compared to T2*-weighted gradient echo sequences in the detection of cerebral cavernous malformations in the familial form. Neuroradiol J. 2016 Oct;29(5):326-35. doi: 10.1177/1971400916665376. Epub 2016 Aug 22. PMID: 27549150; PMCID: PMC5033099.
- Hori M, Ishigame K, Kabasawa H. Pre and post-gadolinium enhanced susceptibility-weighted imaging at 1.5T for intracranial neoplasms: Contrast of pathologic lesions. Proc Intl Soc Mag Reson Med. 2007; 15:3764.
- Valenzuela RF, Madewell JE, Kundra V, Costelloe CM. Advanced Imaging in Musculoskeletal Oncology: Moving Away From RECIST and Embracing Advanced Bone and Soft Tissue Tumor Imaging (ABASTI)-Part II-Novel Functional Imaging Techniques. Semin Ultrasound CT MR. 2021 Apr;42(2):215-227. doi: 10.1053/j.sult.2020.08.013. Epub 2020 Aug 29. PMID: 33814107.
- Haacke EM, Xu Y, Cheng YC, Reichenbach JR. Susceptibility weighted imaging (SWI). Magn Reson Med. 2004 Sep;52(3):612-8. doi: 10.1002/mrm.20198. PMID: 15334582.
- Haacke EM, Mittal S, Wu Z, Neelavalli J, Cheng YC. Susceptibility-weighted imaging: technical aspects and clinical applications, part 1. AJNR Am J Neuroradiol. 2009 Jan;30(1):19-30. doi: 10.3174/ajnr.A1400. Epub 2008 Nov 27. PMID: 19039041; PMCID: PMC3805391.
- Böker SM, Adams LC, Bender YY, Fahlenkamp UL, Wagner M, Hamm B, Makowski MR. Differentiation of Predominantly Osteoblastic and Osteolytic Spine Metastases by Using Susceptibility-weighted MRI. Radiology. 2019 Jan;290(1):146-154. doi: 10.1148/radiol.2018172727. Epub 2018 Oct 30. PMID: 30375926.
- Liu J, Chen Y, Bao XM, Ling XL, Ding JP, Zhang ZK. [Study of susceptibility weighted imaging on MR and pathologic findings to distinguish benign or malignant soft tissue tumor]. Zhonghua Zhong Liu Za Zhi. 2017 May 23;39(5):350-354. Chinese. doi: 10.3760/cma.j.issn.0253-3766.2017.05.006. PMID: 28535651.
- Valenzuela RF, Amini B, Duran-Sierra E, Canjirathinkal M, Idrees H, Madewell J, Costelloe C, Murphy W. Susceptibility-Weighted Imaging (SWI) in Benign and Malignant Tumors of the Musculoskeletal System. https://dx.doi.org/10.26044/ecr2023/C-19005
- Duran-Sierra E, Valenzuela RF, Canjirathinkal M, Madewell J, Murphy W, Costelloe C, Amini B. Susceptibility Imaging (SWI) Morphologic Patterns and High-Order Radiomics of Baseline and Post-Treatment Advanced MRI of Extremity Soft-Tissue Undifferentiated Pleomorphic Sarcoma. https://dx.doi.org/10.26044/ecr2023/C-19060
- Peeken JC, Neumann J, Asadpour R, Leonhardt Y, Moreira JR, Hippe DS, Klymenko O, Foreman SC, von Schacky CE, Spraker MB, Schaub SK, Dapper H, Knebel C, Mayr NA, Woodruff HC, Lambin P, Nyflot MJ, Gersing AS, Combs SE. Prognostic Assessment in High-Grade Soft-Tissue Sarcoma Patients: A Comparison of Semantic Image Analysis and Radiomics. Cancers (Basel). 2021 Apr 16;13(8):1929. doi: 10.3390/cancers13081929. PMID: 33923697; PMCID: PMC8073388.
- Del Grande F, Subhawong T, Weber K, Aro M, Mugera C, Fayad LM. Detection of soft-tissue sarcoma recurrence: added value of functional MR imaging techniques at 3.0 T. Radiology. 2014 May;271(2):499-511. doi: 10.1148/radiol.13130844. Epub 2014 Feb 1. PMID: 24495264.
- Jaovisidha S, Traiporndeeprasert P, Chitrapazt N, Thakkinstian A, Nartthanarung A, Subhadrabandhu T, Siriwongpairat P. Dynamic contrasted MR imaging in differentiation of recurrent malignant soft tissue tumor from posttreatment changes. J Med Assoc Thai. 2011 Sep;94(9):1127-33. PMID: 21970204.
- Lehotska V, Tothova L, Valkovic L. The role of dynamic contrast-enhanced MRI in differentiation of local recurrence and residual soft-tissue tumor versus post-treatment changes. Bratisl Lek Listy. 2013;114(2):88-92. doi: 10.4149/bll_2013_020. PMID: 23331205.
- Nishino M, Hatabu H, Hodi FS. Imaging of Cancer Immunotherapy: Current Approaches and Future Directions. Radiology. 2019 Jan;290(1):9-22. doi: 10.1148/radiol.2018181349. Epub 2018 Nov 20. PMID: 30457485; PMCID: PMC6312436.