
More Information
Submitted: February 05, 2024 | Approved: March 06, 2024 | Published: March 07, 2024
How to cite this article: Gao K, Yu T, Wang C, Jia J. Exploring the Prognostic Efficacy of Machine Learning Models in Predicting Adenocarcinoma of the Esophagogastric Junction. J Radiol Oncol. 2024; 8: 003-013.
DOI: 10.29328/journal.jro.1001059
Copyright License: © 2024 Gao K, et al. This is an open access article distributed under the Creative Commons Attribution License, which permits unrestricted use, distribution, and reproduction in any medium, provided the original work is properly cited.
Keywords: Adenocarcinoma of Esophagogastric Union (AEG); Artificial Intelligence (AI); Machine Learning (ML); Cox proportional hazards regression model (Cox-PH); Extreme gradient boosting (XGBoost)

Exploring the Prognostic Efficacy of Machine Learning Models in Predicting Adenocarcinoma of the Esophagogastric Junction
Kaiji Gao, Tonghui Yu, Changbing Wang and Jianguang Jia*
Department of Surgical Oncology, Chinese People’s Liberation Army, Joint Logistics Force, 902nd Hospital, China
*Address for Correspondence: Jianguang Jia, Department of Surgical Oncology, The First Affiliated Hospital of Bengbu Medical College, China, Email: [email protected]
Objective: To investigate the value of machine learning and traditional Cox regression models in predicting postoperative survivorship in patients with adenocarcinoma of the esophagogastric junction (AEG).
Methods: This study analyzed clinicopathological data from 203 patients. The Cox proportional risk model and four machine learning models were constructed and internally validated. ROC curves, calibration curves, and clinical decision curves (DCA) were generated. Model performance was assessed using the area under the curve (AUC), while calibration curves determined the fit and clinical significance of the model.
Results: The AUC values of the 3-year survival in the validation set for the Cox regression model, extreme gradient boosting, random forest, support vector machine, and multilayer perceptron were 0.870, 0.901, 0.791, 0.832, and 0.725, respectively. The AUC values of 5-year survival in the validation set for each model were 0.915, 0.916, 0.758, 0.905, and 0.737, respectively. The internal validation AUC values for the four machine learning models, extreme gradient boosting, random forest, support vector machine, and multilayer perceptron, were 0.818, 0.772, 0.804, and 0.745, respectively.
Conclusion: Compared with Cox regression models, machine learning models do not need to satisfy the assumption of equal proportionality or linear regression models, can include more influencing variables, and have good prediction performance for 3-year and 5-year survival rates of AEG patients, among which, XGBoost models are the most stable and have significantly better prediction performance than other machine learning methods and are practical and reliable.
Among gastrointestinal tumors, Esophagogastric Junction (EGJ) tumors have received more attention due to their special anatomical location. The clinical incidence of AEG has been on the rise in various countries [1-3], including China, Japan, and other Asian countries [4]. The features of AEG are comparable to those of gastric and esophageal cancers, but are different in that; its lymph node metastasis can reach up to the mediastinum and down to the abdominal cavity, and the location of the tumor is at the esophagogastric junction, which complicates surgery. Due to the different clinicopathological stages and treatment plans, there are marked variations in the prognosis of AEG patients.
In cohort studies, the Cox proportional hazards regression model (Cox-PH) is commonly used to identify risk factors and construct predictive models using survival data [5]. The Cox-PH can define the importance of variables based on hazard ratios, which have intuitive and explanatory characteristics. However, Cox-PH is limited by assumptions such as equal proportional risk and linearity, which affect the predictive effects of the model if they are not satisfied. In addition, it is challenging to include variables with nonlinear and complex relationships in Cox-PH [6]. Machine learning (ML) is a subset of Artificial Intelligence (AI) that involves the development of an algorithm by learning processed data and information, through which the machine learns how to make decisions. In simple terms, ML refers to computer algorithms that are automatically improved through experience [7], including extreme gradient boosting (XGBoost), Random Forest (RF), support vector machines (SVM), and Multi-layer Perceptron (MLP) among others. These algorithms are increasingly being used in prognostic studies of lung cancer, breast cancer, liver cancer, gastrointestinal cancer, and other malignant tumors [8-12]. Currently, it is not clear which of the traditional Cox-PH models and ML models has better or poor prognostic prediction performance for AEG. Therefore, we constructed a Cox-PH model and an ML model to compare the predictive efficacy of the two models for survival outcomes in AEG patients.
Data collection
Two hundred and seventy-seven AEG patients admitted at the First Affiliated Hospital of Bengbu Medical College from 09, 2015 to 10, 2020 were selected. Inclusion criteria were: meet the World Health Organization criteria for the definition of AEG (tumor center located within 5 cm above and below the EGJ, and the tumor itself must span or directly contact the EGJ, pathologically adenocarcinoma [13]). The exclusion criteria were: i. Patients who did not meet the WHO definition of AEG; ii. Patients with incomplete clinical data; iii. Patients with combined severe cardiopulmonary disease; iv. Patients with postoperative lost visits; v. Patients who had not been surgically treated and vi. Those with unknown causes of death. After exclusion, 203 cases were finally included for analysis. A 5-year follow-up was conducted by telephone up to 04/2022.
Data processing
Relevant literature was reviewed to identify the factors that may affect AEG prognosis. A total of 19 factors were identified, including the patient’s preoperative gender, age, Borrmann staging, degree of differentiation, depth of infiltration (T stage), number of lymph node metastases (N stage), pathological TNM stage, maximum tumor diameter, postoperative chemotherapy, fibrinogen (Fibr), D-dimer (D-dimer), surgical approach, postoperative hospitalization duration, nutritional index (PNI), neutrophil count (NEU) to lymphocyte count (LYM) ratio (NLR), white ball ratio (WBR), serum carcinoembryonic antigen (CEA), alpha-fetoprotein (AFP), and glycoconjugate antigen 199 (CA199). The 11 continuous variables including age (y), tumor size (cm), Fibr (g/L), D-dimer (mg/L), PNI, postoperative hospital stay (d), NLR, WRB, CEA (ng/mL), AFP (ng/mL), and CA199 (IU/mL) had too many values before analysis, which may easily cause model overfitting. Therefore, to achieve the required parameters, the X tile 3.6.1 software (developed by Yale University) [14] was used to obtain the best-truncated values for these 11 continuous variables. The 19 prognostic associated factors were quantified and transformed for analysis using SPSS 26.0, R4.2.2, Rstudio2022, and python3.11.0.
Partitioning of the training and validation sets
Survival curves were plotted using the Kaplan-Meier method of survival analysis (Figure 1) to determine whether the variables met the proportional risk hypothesis and to estimate the survival rate of AEG under different influencing factors, using the Log-rank test for statistically significant differences between groups (Table 1). Under the condition that the variables met the proportional risk hypothesis test, the variables were subjected to one-way Cox regression analysis, and the p < 0.05 variables that were statistically significant in the one-way analysis were analyzed and included as covariates in the multi-way Cox regression, and the variables that were statistically significant (p < 0.05) in the multi-way analysis were obtained (Table 2), and the data of 203 patients were analyzed based on the one-way Cox regression analysis (p < 0.05) data were divided into 153 cases in the training set and 50 cases in the validation set using the random number table method in a ratio of 3:1. The chi-square test (χ²) was used to compare categorical variables between the training and validation sets, and continuous variables were analyzed statistically descriptive using X ± S (Table 3).
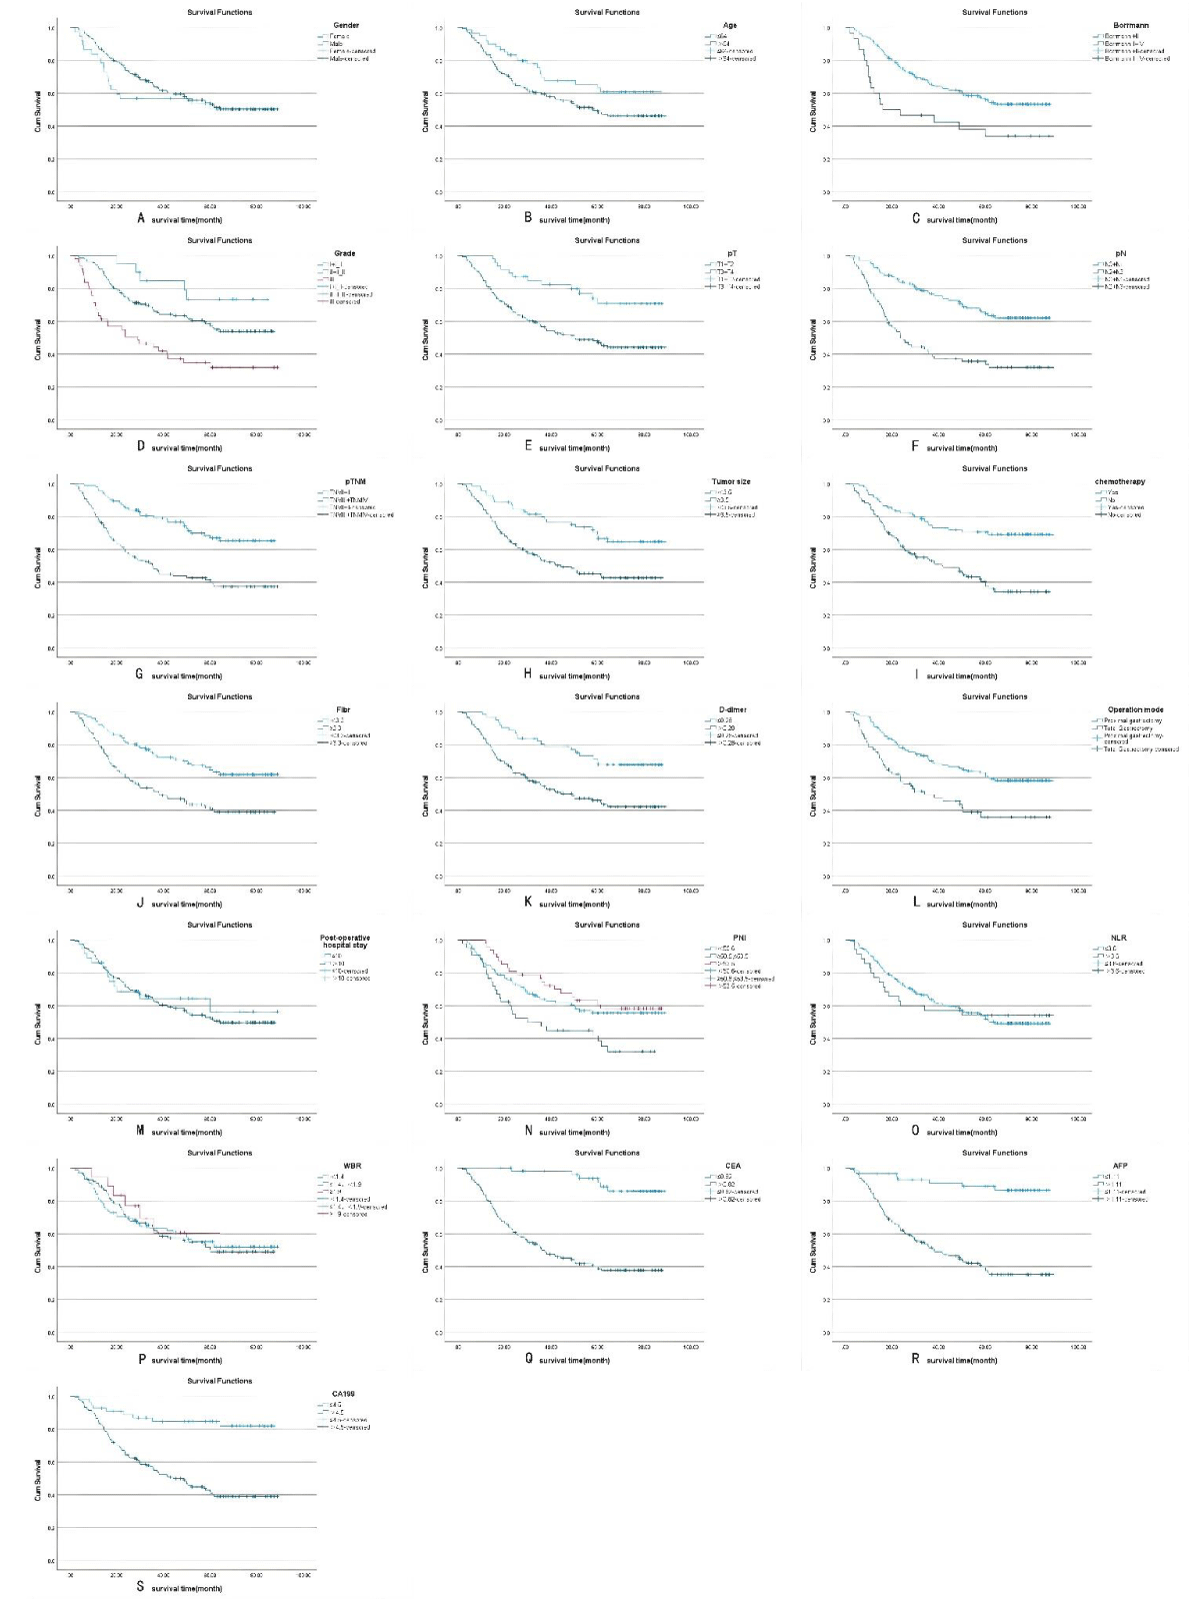
Figure 1: A-S Kaplan-Meier survival curves for the 19 variables, including sex, age, Borrmann staging, degree of differentiation, depth of infiltration (T stage), number of lymph node metastases (N stage), pathological TNM stage, maximum tumor diameter, postoperative chemotherapy, Fibr, D-dimer, surgical approach, postoperative hospital stay, PNI, NLR, WBR, CEA, AFP, and CA19. Among them, sex, postoperative hospital stay, and NLR did not meet the assumption of equal proportions.
| Table 1: Log-rank test. | |||||
| Variable | Number | Mean survival time (months) | χ² | p - value | |
| Gender | 0.414 | 0.52 | |||
| Female | 37 | 52.855 ± 6.040 | |||
| Male | 166 | 58.261 ± 2.649 | |||
| Age | 4.048 | 0.044 | * | ||
| ≤ 64y | 60 | 64.034 ± 4.073 | |||
| > 64y | 143 | 54.188 ± 2.946 | |||
| Borrmann | 8.567 | 0.003 | * | ||
| I+II | 173 | 59.462 ± 2.517 | |||
| III+IV | 30 | 41.859 ± 6.705 | |||
| Grade | 18.281 | 0 | * | ||
| I+I-II | 20 | 71.723 ± 5.106 | |||
| II+II-III | 134 | 59.988 ± 2.836 | |||
| III | 49 | 41.370 ± 5.078 | |||
| pT | 10.694 | 0.001 | * | ||
| T1+T2 | 47 | 72.334 ± 3.849 | |||
| T3+T4 | 156 | 52.633 ± 2.839 | |||
| pN | 26.475 | 0 | * | ||
| N0+N1 | 125 | 66.414 ± 2.713 | |||
| N2+N3 | 78 | 41.919 ± 3.947 | |||
| pTNM | 19.626 | 0 | * | ||
| I+II | 94 | 68.581 ± 2.983 | |||
| III+IV | 109 | 47.004 ± 3.414 | |||
| Tumor size | 11.284 | 0.001 | * | ||
| < 3.5 cm | 71 | 69.329 ± 3.482 | |||
| ≥ 3.5 cm | 132 | 50.410 ± 3.064 | |||
| chemotherapy | 19.133 | 0 | * | ||
| yes | 90 | 68.930 ± 3.32 | |||
| no | 113 | 47.436 ± 3.170 | |||
| Fibr | 13.163 | 0 | * | ||
| < 3.3 g/L | 102 | 66.364 ± 3.131 | |||
| ≥ 3.3 g/L | 101 | 47.963 ± 3.473 | |||
| D-dimer | 12.6 | 0 | * | ||
| ≤ 0.28 mg/L | 62 | 70.271 ± 3.445 | |||
| < 0.28 mg/L | 141 | 51.170 ± 3.028 | |||
| Operation mode | 12.778 | 0 | * | ||
| Proximal gastrectomy | 129 | 63.639 ± 2.837 | |||
| Total gastrectomy | 74 | 45.554 ± 4.194 | |||
| Postoperative hospital stay | 0.11 | 0.741 | |||
| ≤ 10 d | 36 | 59.918 ± 6.313 | |||
| > 10 d | 167 | 56.544 ± 2.596 | |||
| PNI | 8.233 | 0.016 | * | ||
| < 50.6 | 112 | 59.526 ± 3.335 | |||
| ≥ 50.6, ≤ 53.5 | 43 | 44.156 ± 4.966 | |||
| > 53.5 | 47 | 64.169 ± 4.326 | |||
| NLR | 0.001 | 0.975 | |||
| ≤ 3.6 | 168 | 56.984 ± 2.598 | |||
| > 3.6 | 35 | 55.507 ± 6.257 | |||
| WBR | 0.155 | 0.925 | |||
| < 1.4 | 88 | 57.330 ± 3.780 | |||
| ≥ 1.4, < 1.9 | 97 | 56.135 ± 3.408 | |||
| ≥ 1.9 | 18 | 58.876 ± 7.839 | |||
| CEA | 34.647 | 0 | * | ||
| ≤ 0.82 ng/mL | 54 | 83.681 ± 1.993 | |||
| > 0.82 ng/mL | 149 | 47.518 ± 2.817 | |||
| AFP | 34.871 | 0.005 | * | ||
| ≤ 1.11 ng/mL | 58 | 79.718 ± 2.777 | |||
| > 1.11 ng/mL | 145 | 47.807 ± 2.855 | |||
| CA199 | 21.836 | 0 | * | ||
| ≤ 4.5I U/mL | 54 | 75.832 ± 3.561 | |||
| > 4.5I U/mL | 149 | 50.319 ± 2.827 | |||
| *: Log-rank test results for variables with p - values ≤ 0.05. | |||||
| Table 2: Cox univariate and multifactor analysis. | ||||||||
| Univariate analysis | Multivariate analysis | |||||||
| HR(95%CI) | coef | p - value | HR(95% CI) | coef | p - value | |||
| Gender | 0.845(0.505 - 1.414) | - 0.169 | 0.52 | |||||
| Female | ||||||||
| Male | ||||||||
| Age | 1.639(1.008 - 2.665) | 0.494 | 0.046 | * | 1.043(0.608 - 1.787) | 0.042 | 0.879 | |
| ≤ 64 y | ||||||||
| > 64 y | ||||||||
| Borrmann | 2.090(1.261 - 3.463) | 0.737 | 0.004 | * | 2.156(1.211 - 3.838) | 0.768 | 0.009 | ** |
| I+II | ||||||||
| III+IV | ||||||||
| Grade | 0 | * | 0.216 | |||||
| I+I - II | ||||||||
| II+II - III | 2.048(0.820 - 5.114) | 0.717 | 0.125 | 1.362(0.522 - 3.552) | 0.309 | 0.528 | ||
| III | 4.447(1.730 - 11.428) | 1.492 | 0.002 | 1.977(0.725 - 5.393) | 0.682 | 0.183 | ||
| pT | 2.647(1.443 - 4.855) | 0.973 | 0.002 | * | ||||
| T1+T2 | ||||||||
| T3+T4 | ||||||||
| pN | 2.808(1.862 - 4.233) | 1.032 | 0 | * | ||||
| N0+N1 | ||||||||
| N2+N3 | ||||||||
| pTNM | 2.605(1.678 - 4.044) | 0.957 | 0 | * | 1.991(1.249 - 3.175) | 0.689 | 0.004 | ** |
| I+II | ||||||||
| III+IV | ||||||||
| Tumor size | 2.204(1.373 - 3.536) | 0.79 | 0.001 | * | 1.852(1.097 - 3.129) | 0.616 | 0.021 | ** |
| < 3.5 cm | ||||||||
| ≥ 3.5 cm | ||||||||
| chemotherapy | 2.657(1.686 - 4.189) | 0.977 | 0 | * | 3.014(1.791 - 5.07) | 1.103 | 0 | ** |
| yes | ||||||||
| no | ||||||||
| Fibr | 2.138(1.404 - 3.256) | 0.76 | 0 | * | 1.007(0.626 - 1.618) | 0.007 | 0.978 | |
| < 3.3 g/L | ||||||||
| ≥ 3.3 g/L | ||||||||
| D - dimer | 2.430(1.465 - 4.032) | 0.888 | 0.001 | * | 1.549(0.887 - 2.703) | 0.437 | 0.124 | |
| ≤ 0.28 mg/L | ||||||||
| > 0.28 mg/L | ||||||||
| Operation mode | 2.091(1.383 - 3.163) | 0.738 | 0 | * | 1.607(1.016 - 2.541) | 0.474 | 0.043 | * |
| Proximal gastrectomy | ||||||||
| Total gastrectomy | ||||||||
| Postoperative hospital stay | 1.104(0.614 - 1.987) | 0.099 | 0.741 | |||||
| ≤ 10 d | ||||||||
| > 10 d | ||||||||
| PNI | 0.019 | * | ||||||
| < 50.6 | 0.069 | |||||||
| ≥ 50.6 ,≤ 53.5 | 1.759(1.093 - 2.830) | 0.02 | 1.877(1.099 - 3.204) | 0.629 | 0.021 | |||
| > 53.5 | 0.817(0.478 - 1.395) | 0.458 | 1.298(0.709 - 2.378) | 0.261 | 0.398 | |||
| NLR | 1.009(0.588 - 1.730) | 0.975 | ||||||
| ≤ 3.6 | ||||||||
| > 3.6 | ||||||||
| WBR | 0.973(0.704 - 1.345) | 0.87 | ||||||
| < 1.4 | ||||||||
| ≥ 1.4, < 1.9 | ||||||||
| ≥ 1.9 | ||||||||
| CEA | 8.128(3.546 - 18.632) | 0 | * | 3.581(1.523 - 8.421) | 1.276 | 0.003 | ** | |
| ≤ 0.82 ng/mL | ||||||||
| >0.82ng/mL | ||||||||
| AFP | 7.356(3.393 - 15.945) | 0 | * | 3.327(1.460 - 7.586) | 1.202 | 0.004 | ** | |
| ≤1.11ng/mL | ||||||||
| >1.11ng/mL | ||||||||
| CA199 | 4.482(2.250 - 8.929) | 0 | * | 1.608(0.777 - 3.331) | 0.475 | 0.201 | ||
| ≤4.5IU/mL | ||||||||
| >4.5IU/mL | ||||||||
| *: Variables with a p - value ≤ 0.05 in the results of Cox univariate analysis. **: Variables with p - values ≤ 0.05 in the results of Cox multivariate analysis. | ||||||||
| Table 3: The variables with p < 0.05 in the results of Cox univariate analysis were divided into training and validation sets. | |||
| Training Set | Validation Set | ||
| n = 153 | n = 50 | ||
| variables | Mean ± SD /N(%) | Mean ± SD /N(%) | p - value |
| Survival(month) | 45.742 ± 2.209 | 43.7992 ± 3.876 | 2.496 |
| Age | |||
| ≤ 64 | 46 (30.1%) | 14 (28%) | 0.921 |
| > 64 y | 107 (69.9%) | 36 (72%) | |
| Borrmann | |||
| I+II | 128 (83.7%) | 45 (90%) | 0.386 |
| III+IV | 25 (16.3%) | 5 (10%) | |
| pT | |||
| T1+T2 | 33 (21.6%) | 14 (28%) | 0.458 |
| T3+T4 | 120 (78.4%) | 36 (72%) | |
| pN | |||
| N0+N1 | 95 (62.1%) | 30 (60%) | 0.923 |
| N2+N3 | 58 (37.9%) | 20 (40%) | |
| pTNM | |||
| I+II | 71 (46.4%) | 23 (46%) | 1 |
| III+IV | 82 (53.6%) | 27 (54%) | |
| Tumor size | |||
| < 3.5 cm | 52 (34%) | 19 (38%) | 0.73 |
| ≥ 3.5 cm | 101 (66%) | 31 (62%) | |
| chemotherapy | |||
| yes | 69 (45.1%) | 21 (42%) | 0.827 |
| no | 84 (54.9%) | 29 (58%) | |
| Fibr | |||
| < 3.3 g/L | 80 (52.3%) | 22 (44%) | 0.393 |
| ≥ 3.3 g/L | 73 (47.7%) | 28 (56%) | |
| D-dimer | |||
| ≤ 0.28 mg/L | 49 (32%) | 13 (26%) | 0.531 |
| > 0.28 mg/L | 104 (68%) | 37 (74%) | |
| Operation mode | |||
| Proximal gastrectomy | 99 (64.7%) | 30 (60%) | 0.666 |
| Total gastrectomy | 54 (35.3%) | 20 (40%) | |
| CEA | |||
| ≤ 0.82 ng/mL | 38 (24.8%) | 16 (32%) | 0.417 |
| > 0.82 ng/mL | 115 (75.2%) | 34 (68%) | |
| AFP | |||
| ≤ 1.11 ng/mL | 47 (30.7%) | 11 (22%) | 0.315 |
| > 1.11 ng/mL | 106 (69.3%) | 39 (78%) | |
| CA199 | |||
| ≤ 4.5I U/mL | 40 (26.1%) | 14 (28%) | 0.941 |
| > 4.5I U/mL | 113 (73.9%) | 36 (72%) | |
| Grade | |||
| I+I-II | 15 (9.8%) | 5 (10%) | 1 |
| II+II-III | 101 (66%) | 33 (66%) | |
| III | 37 (24.2%) | 12 (24%) | |
| PNI | |||
| < 50.6 | 89 (58.2%) | 24 (48%) | 0.444 |
| ≥ 50.6, ≤ 53.5 | 31 (20.3%) | 12 (24%) | |
| > 53.5 | 33 (21.6%) | 14 (28%) | |
Construction of models
Cox-PH model: The variables with statistically significant Cox multifactor analysis in the training set were included as independent prognostic factors in the construction of the Cox-PH model. Risk Ratio (HR) and 95% Confidence Interval (CI) were calculated by stepwise regression method and displayed in the form of a Nomogram. Based on the column line graph (Figure 2), the sum of the scores in the training and validation sets was calculated to obtain the total score, and the ROC curves, calibration curves, and clinical decision curves (DCA) for the training and validation sets at 3 and 5 years were plotted according to the column line graph corresponding to survival rates (Figures 3-5).
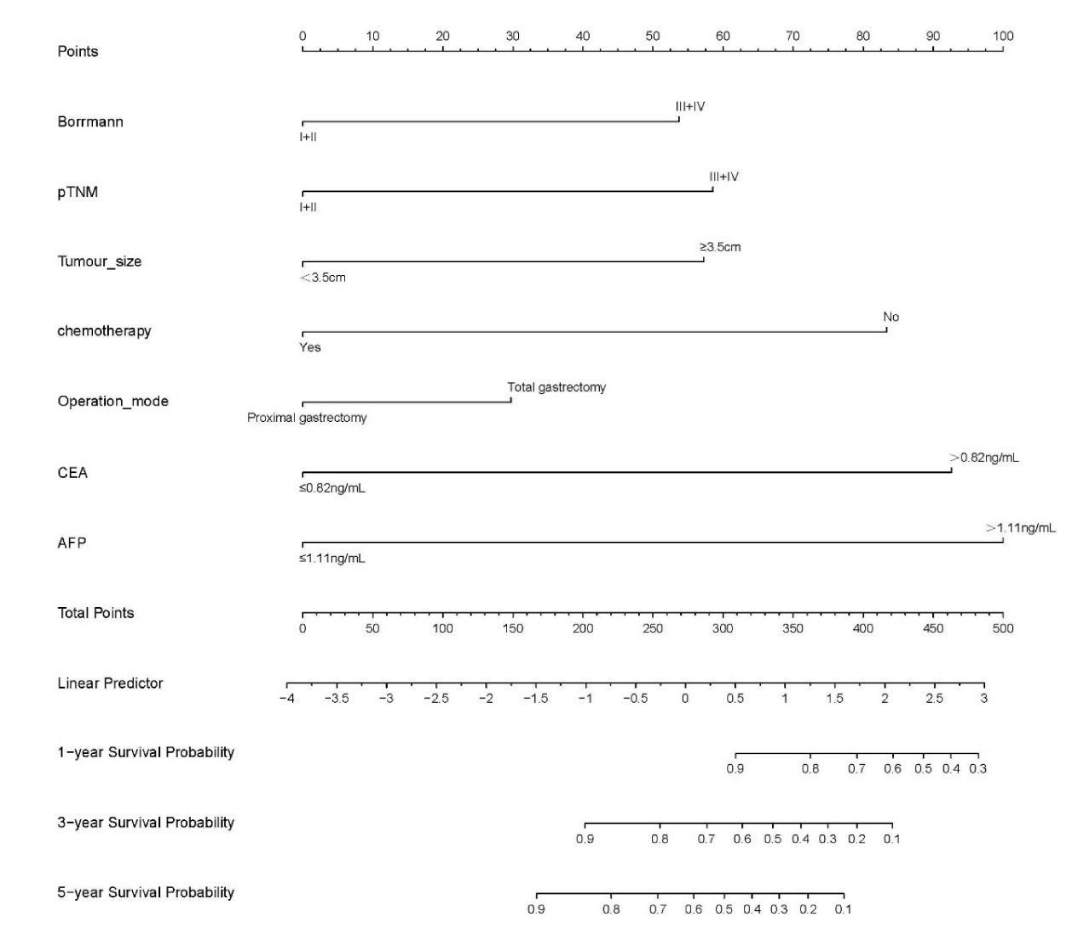
Figure 2: Training set variables that were significant in Cox multifactor analysis (Borrmann staging, pathological TNM stage, maximum tumor diameter, postoperative chemotherapy, surgical approach, CEA, AFP) were included as independent prognostic factors in the construction of the Cox-PH model. The risk ratio (Hazard Ratio, HR) and 95% Confidence Interval (CI) were calculated by stepwise regression method and displayed as a columnar line graph (Nomogram).
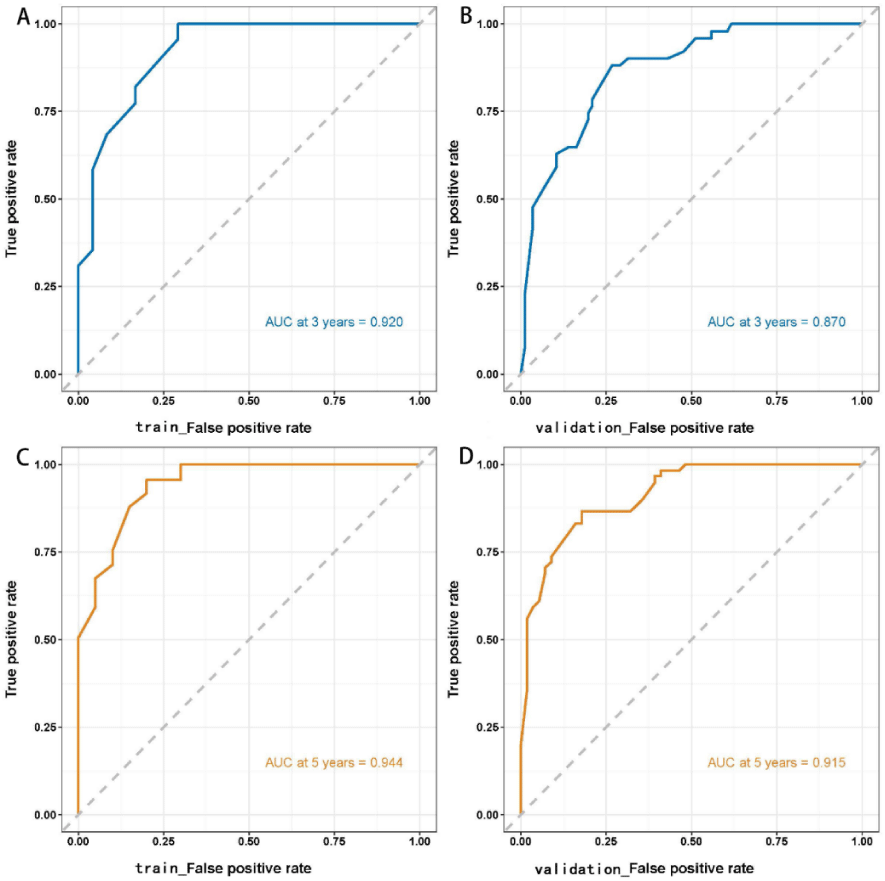
Figure 3: ROC curves of the Cox regression model for predicting 3- and 5-year survival outcomes in the training and validation sets. The AUCs of the Cox regression model in predicting 3- and 5-year survival outcomes in the training set were 0.920 and 0.944, respectively. The model was validated using the validation set, which revealed 3- and 5-year AUCs of 0.870 and 0.915, respectively.
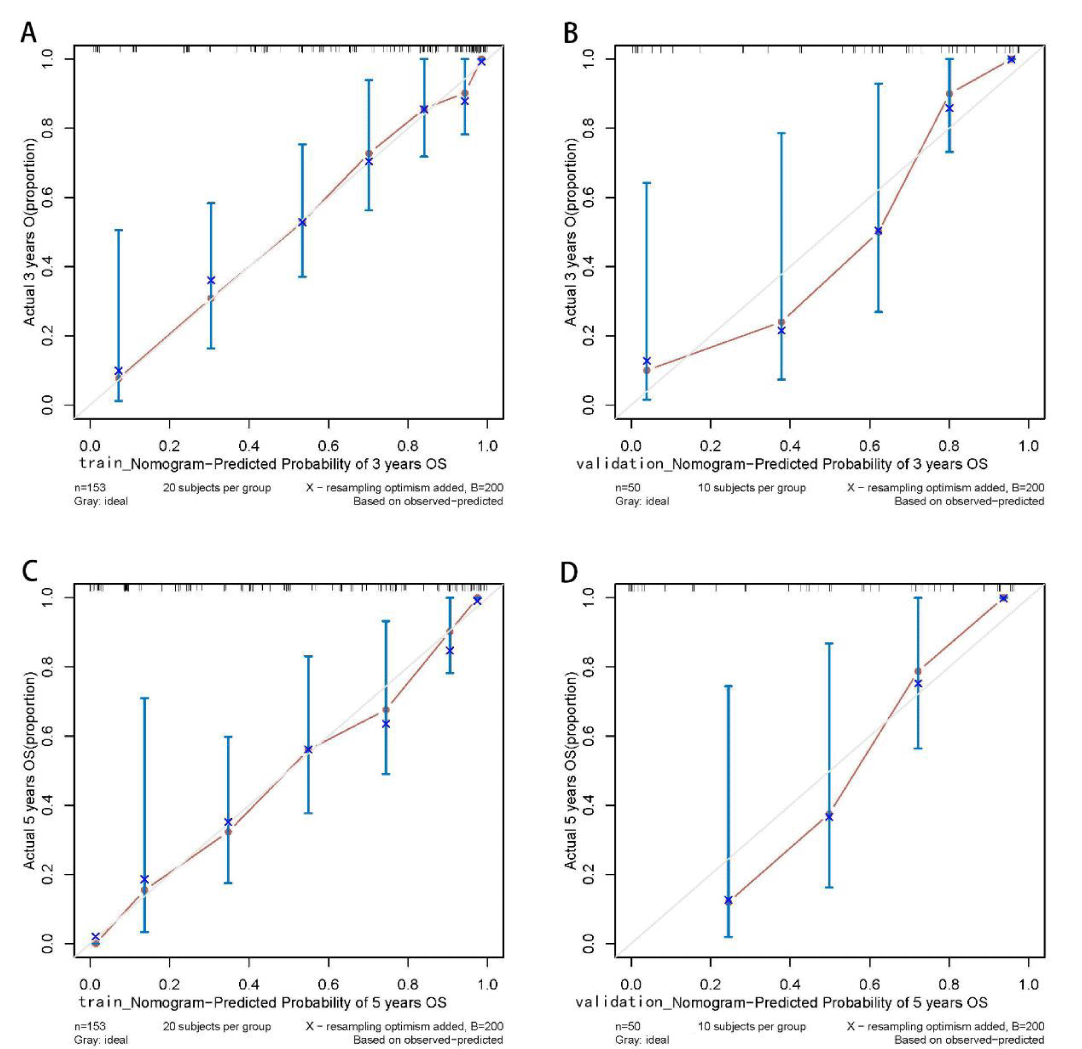
Figure 4: Calibration curves of the Cox regression model for predicting the 3- and 5-year survival outcomes in training and validation sets. The predicted probabilities of the Cox regression model are in good agreement with actual observed values. Training set: sample interval of 20. Validation set: sample interval of 10. n: Number of samples; B: Number of resampling.
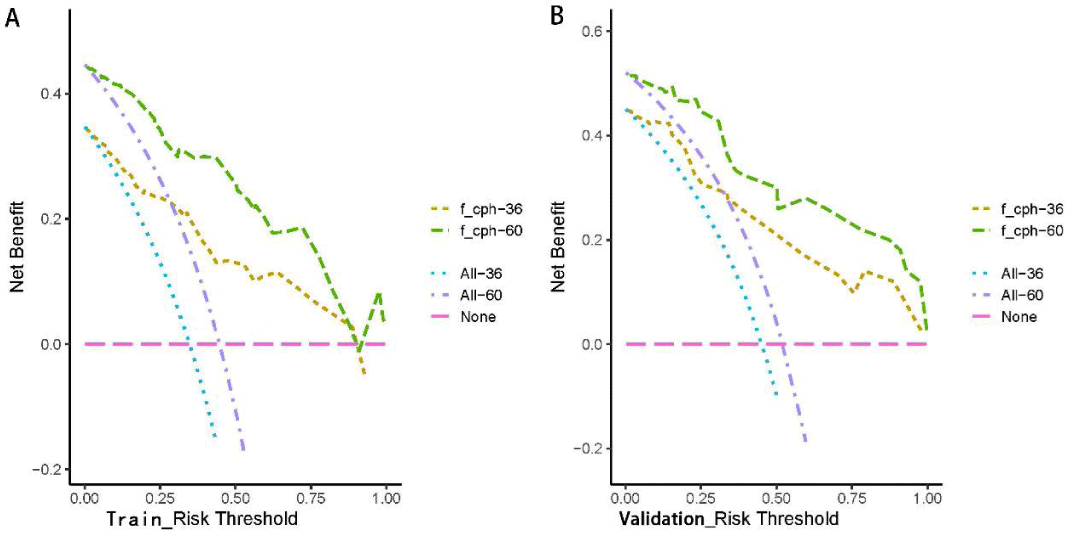
Figure 5: Clinical decision curves (DCA) of the training and validation sets as predicted by the Cox regression model. With the threshold of the model set in the range of 10% - 90%, the decision curve lies above the None line and All line, thus, the model is clinically useful.
Construction of the ML model: Data from the training set of 153 cases were used for modeling, and 13 variables (p < 0.05) were used as input in this study based on Cox’s one-way analysis of variance. The optimal hyperparameters of XGBoost, RF, SVM, and MLP models were determined in the training set using a grid search method, and the default parameters were used for logistic regression. The model was also trained and internally validated using 5-fold resampling validation to obtain the best parameters. Model parameters were: XGBoost model: the optimization objective function uses binary and logistic regression the learning rate was set to 0.3, the maximum tree depth was set to 8, the minimum bifurcation weight sum was set to 4, and the L2 regularization coefficient was set to 1. The RF model: the metric uses gini, the minimum bifurcation purity gain is set to 0.0, and the number of trees is set to 100. In the SVM model: the regularization factor was set to 1.0, the kernel type was set to rbf, and the convergence metric was set to 0.1. The MLP model: the nodes of the input layer, hidden layer 1, hidden layer 2, and output layer were set to 13, 20, 10, and 1, respectively. Each layer was operated using the relu activation function and random initialization. The number of training sessions was 20. The 3- and 5-year AUC values for each model in the training set were calculated after several training sessions and validated in the validation set. To assess the predictive performance of the four ML models, survival prediction was performed for all samples. After randomly establishing the independent training and validation sets at a ratio of 7:3, the training set was subjected to cross-validation for hyperparameter tuning to fully utilize the data in the training set and avoid data leakage in the test set. Validation was performed using the validation set, and the AUC value for each model in the training and test sets was determined. The AUC performance of each model in the training and test sets was calculated.
Statistical methods
Continuous variables were selected using X-tile 3.6.1 for the best-truncated values. Data were analyzed using the SPSS 26.0 software. Comparison of mean values between groups was performed using the t-test, χ2 or exact probability analysis for measurement data, Kaplan-Meier method to count the survival rate of each group, and log-rank method to compare differences between groups. p ≤ 0.05 was set as the threshold for significance. Construction of the cox regression model, machine learning model, graph drawing, and Program development were performed using R software version 4.2.2 (R Foundation for Statistical Computing, Vienna, Austria, http:/www.Rproject.org/), Rstudio (2022, PBC, Boston, MA, http:/www. rstudio.com/) and python 3.11.0.
General patient characteristics
A total of 203 AEG patients (166 males and 37 females, with a male-to-female ratio of 4.48:1 and a mean age of 67.9 years (44 years - 83 years) with > 60 years accounting for 82.84%) were enrolled in this study. Eleven continuous variables, including age (64 y), tumor size (3.5 cm), Fibr (3.3 g/L), D-dimer (0.28 mg/L), PNI (50.6, 53.5), postoperative hospital stay (10 d), NLR (3.6), WRB (1.4,1.9), CEA (0.82 ng/mL), AFP (1.11 ng/mL), and CA199 (4.5 IU/mL) were selected by X-tile for the best cut-off values. Grouping results are shown in Table 1.
Predictive efficacy of the Cox-PH model
The Kaplan-Meier method was used to plot the survival curves for 19 variables (Figure 1). According to survival curves, among which gender, postoperative hospital stay and NLR did not meet the assumption of equal proportions, Log-rank test showed that 15 variables, including age (p = 0.044), Borrmann staging (p = 0.003), degree of differentiation (p = 0.000), depth of infiltration (p = 0.001), number of lymph node metastases (p = 0.000), pathological TNM stage (p = 0.000), maximum tumor diameter (p = 0.001), postoperative chemotherapy (p = 0.000), Fibr (p = 0.000), D-dimer (p = 0.000), surgical approach (p = 0.000), PNI (p = 0.016), CEA (p = 0.000), AFP (p = 0.005), and CA199 (p =0.000) were significant (p < 0.05) (Table 1). Excluding the depth of infiltration and the number of lymphatic metastases, the 15 variables with p < 0.05 in univariate analysis were subjected to Cox multivariate analysis to obtain 7 significant variables (p < 0.05), which were: Borrmann staging (p = 0.009), pathological TNM stage (p = 0.004), maximum tumor diameter (p = 0.021), postoperative chemotherapy (p = 0.000), surgical approach (p = 0.043), CEA (p = 0.003), and AFP (p = 0.004) (Table 2). The data were divided into training and validation groups based on the above seven variables, and the groups were compared using the Log-rank test. p - values for all variables between groups were greater than 0.05, and the grouping effect was good (Table 3). The Cox regression model predicted the 3- and 5-year AUCs for the training set, which were 0.920 and 0.944, respectively. The model was validated using the validation set which showed 3- and 5-year AUCs of 0.870 and 0.915, respectively. Clinical decision curves (DCA) for the training and validation sets of the Cox regression model (Figure 5) suggest that the decision curves lie above the None and All lines with the threshold of the model set in the 10% - 90% threshold range. Therefore, the model has a high clinical utility. The calibration curves suggest that the predicted probabilities of the Cox regression model are in good agreement with actual observed values.
Predictive effectiveness of the machine learning model
The AUC values for the 3-year predictive performance of the four machine learning models based on random independent division of the training set were; XGBoost (AUC = 0.913), RF (AUC = 0.997), SVM (AUC = 0.954), and MLP (AUC = 0.701). The AUC values for 5-year prediction were XGBoost (AUC = 0.922), RF (AUC = 0.999), SVM (AUC = 0.953), and MLP (AUC = 0.784). The validation set was used to validate the model, and the predicted AUC values for 3 years were XGBoost (AUC = 0.901), RF (AUC = 0.791), SVM (AUC = 0.832), and MLP (AUC = 0.725). The predicted AUC values for 5 years were XGBoost (AUC = 0.916), RF (AUC = 0.758), SVM (AUC = 0.905), and MLP (AUC = 0.737) (Table 4). The four ML models divided the training set based on all patient data independently and predicted the survival rate of the training set with the following results. XGBoost (AUC = 0.900), RF (AUC = 0.999), SVM (AUC = 0.928), and MLP (AUC = 0.781); the validation set was validated against the models, and survival outcomes were: XGBoost (AUC = 0.818), RF (AUC = 0.772), SVM (AUC = 0.804), MLP (AUC = 0.745) (Table 5). By plotting the clinical decision curves predicted by the four model validation sets (Figure 6), the best cutoff values of the models in ROC analysis for the four ML model validation sets were XGBoost (cutoff = 38.5%), RF (cutoff = 50.7%), MLP (cutoff = 46.1%), and SVM (cutoff = 46.0%). At the threshold, the decision curves of the XGBoost and SVM models were located above the None and All lines, while the decision curves of MLP and RF models were not or not completely above the None and All lines. Therefore, the XGBoost and SVM models showed good clinical utility. The AUC score forest plots, calibration curves (Figures 7,8), and clinical decision curves predicted by the four ML models were combined. The stability of the XGBoost model was found to be better; the SVM prediction efficacy was second; the predictive probability of the RF model was less consistent with the actual observed values and may be overfitted, i.e., excellent performance in the training set but poor performance in the validation set [15]. The predicted probability and actual observed values of the MLPL model were not satisfactory.
| Table 4: Comparison of 3-year and 5-year prediction performance of various machine learning models in training and validation sets. | |||||||||
| Training Set | Validation Set | ||||||||
| Model | AUC | Accuracy | Sensitivity | Specificity | AUC | Accuracy | Sensitivity | Specificity | |
| XGBoost | |||||||||
| 3 y | 0.913 | 0.81 | 0.852 | 0.795 | 0.901 | 0.772 | 0.9 | 0.71 | |
| 5 y | 0.922 | 0.845 | 0.848 | 0.855 | 0.916 | 0.872 | 0.957 | 0.853 | |
| RF | |||||||||
| 3 y | 0.997 | 0.965 | 1 | 0.944 | 0.791 | 0.672 | 0.667 | 0.8 | |
| 5 y | 0.999 | 0.979 | 1 | 0.963 | 0.758 | 0.623 | 1 | 0.455 | |
| SVM | |||||||||
| 3 y | 0.954 | 0.873 | 0.944 | 0.841 | 0.832 | 0.801 | 0.78 | 0.61 | |
| 5 y | 0.953 | 0.894 | 0.984 | 0.838 | 0.905 | 0.821 | 0.926 | 0.588 | |
| MLP | |||||||||
| 3 y | 0.501 | 0.606 | 0.255 | 0.813 | 0.425 | 0.541 | 0.348 | 0.684 | |
| 5 y | 0.784 | 0.711 | 0.763 | 0.699 | 0.737 | 0.656 | 0.9 | 0.548 | |
| XGBoost: eXtreme Gradient Boosting; RF: Random Forests; SVM: Support Vector machines; MLP: Multi-layer Perceptron | |||||||||
| Table 5: Analysis of the predictive performance of each model in the training and validation sets. | |||||||||||
| Training Set | Validation Set | ||||||||||
| Model | AUC | Cutoff | Accuracy | Sensitivity | Specificity | AUC | Cutoff | Accuracy | Sensitivity | Specificity | |
| XGBoost | 0.9 | 0.453 | 0.812 | 0.883 | 0.76 | 0.818 | 0.385 | 0.727 | 0.85 | 0.764 | |
| RF | 0.999 | 0.503 | 0.977 | 1 | 0.959 | 0.772 | 0.507 | 0.689 | 0.791 | 0.755 | |
| MLP | 0.781 | 0.459 | 0.721 | 0.705 | 0.743 | 0.745 | 0.461 | 0.658 | 0.818 | 0.709 | |
| SVM | 0.928 | 0.464 | 0.85 | 0.865 | 0.848 | 0.804 | 0.46 | 0.733 | 0.828 | 0.755 | |
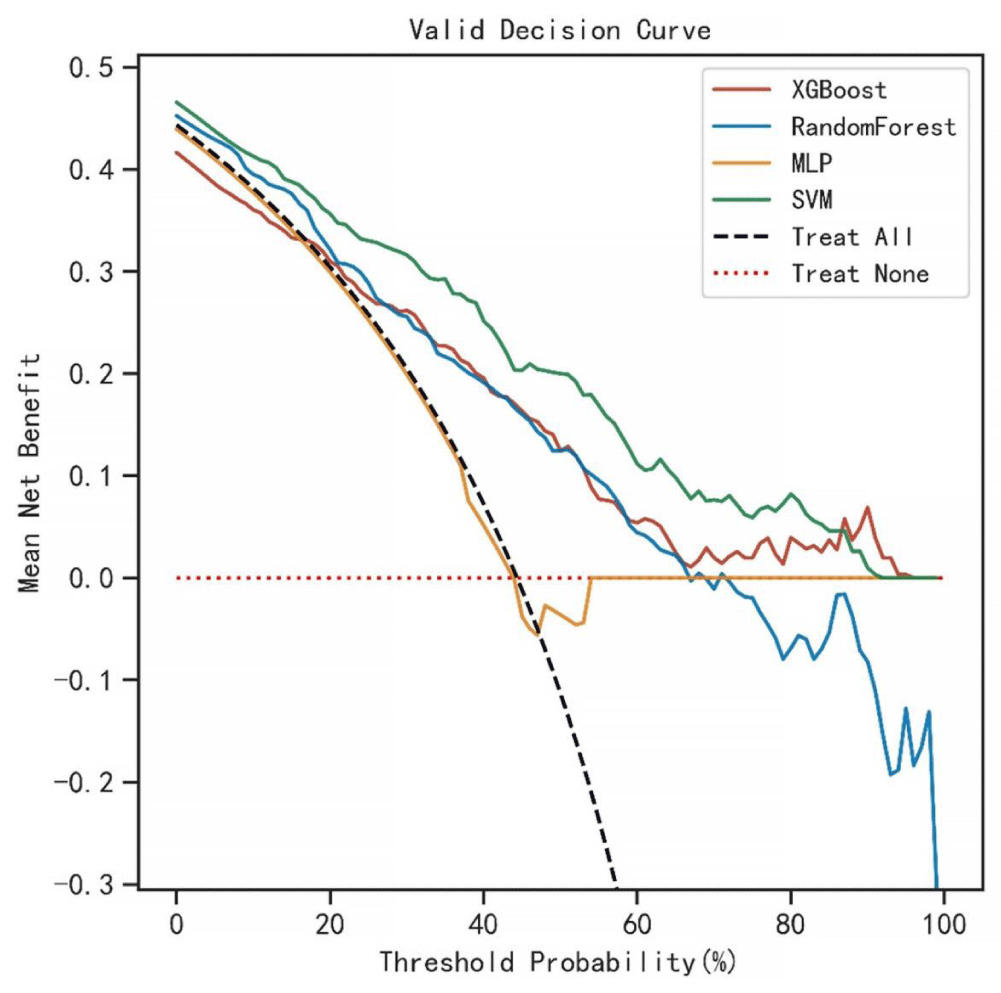
Figure 6: Clinical decision curves (DCA) for predictions of the four ML models. Optimal cutoff values of the four models in ROC analysis of the validation set were XGBoost (cutoff = 38.5%), RF (cutoff = 50.7%), MLP (cutoff = 46.1%), and SVM (cutoff = 46.0%), and at this threshold, the decision curves of XGBoost and SVM models lie above the None and All lines, while the decision curves of the MLP and RF models did not or did not completely lie above the None and All lines. Therefore, the XGBoost and SVM models have a clinical utility.
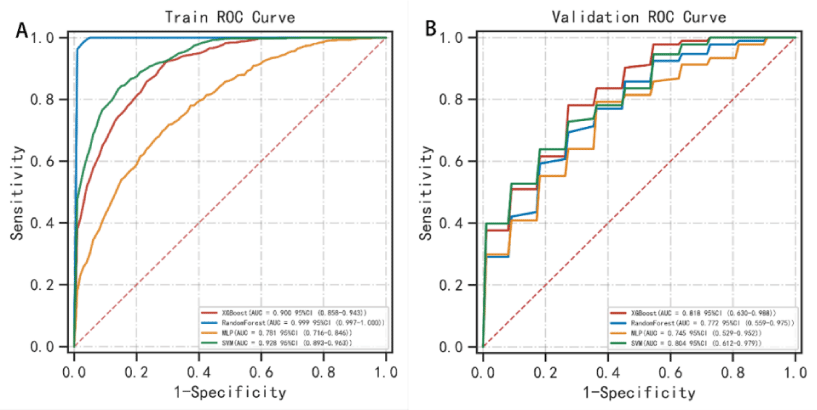
Figure 7: Survival prediction ROC curves of the four ML models in the training and validation sets. In the training set, the predictive performance of survival outcomes for each independent model was: XGBoost (AUC = 0.900), RF (AUC = 0.999), SVM (AUC = 0.928), and MLP (AUC = 0.781) while for the validation set, the predictive performance was: XGBoost (AUC = 0.818), RF (AUC = 0.772), SVM (AUC = 0.804), and MLP (AUC = 0.745).
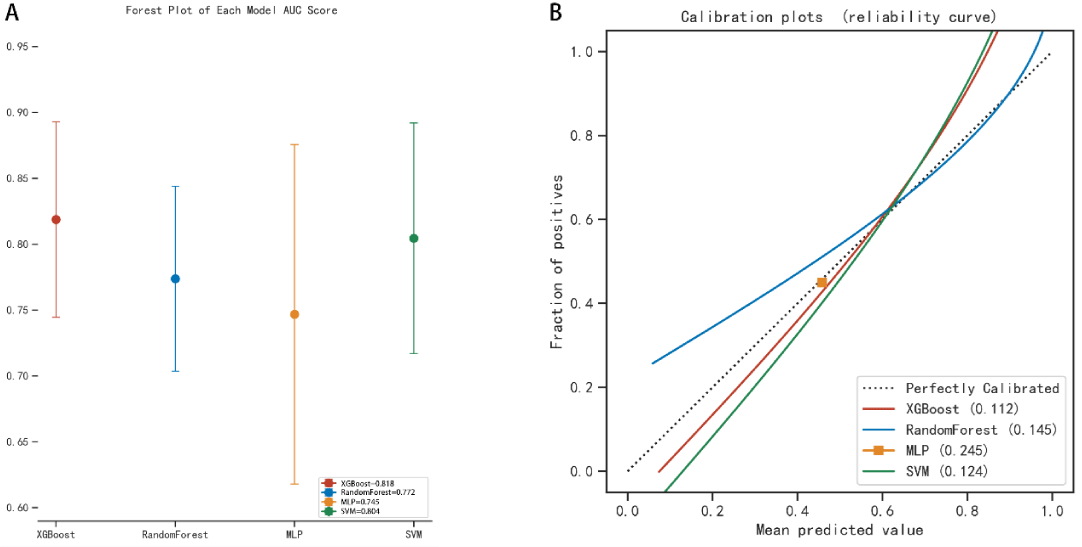
Figure 8: The AUC score forest plots and the calibration curves for survival prediction of the four ML models in the validation set.
Esophagogastric junction (AEG) is located at the junction of stomach and esophagus and its clinical and pathological characteristics are different from those of gastric and esophageal cancers. The early diagnosis rate is low, and most of them have lymph node metastasis at the time of diagnosis [16,17]. The overall prognosis of AEG is poor due to its special anatomical location, compared with that of traditional distal gastric cancer. Studies have shown that the average surgical cure rate is about 80%, and the 5-year survival rate after radical surgery is only about 30% [18,19], and Siewert, et al. [20] reported that the 5-year survival rate after radical surgery for pancreatic cancer is 40%, and the 10-year survival rate is 20%. Marc Ychou, et al. [21] reported an overall 5-year survival rate of 38% after AEG in 113 cases. This study showed that the 3-year survival rate after AEG was 43.8%, the 5-year survival rate was 37.0%, and its 5-year survival rate was slightly lower than the 5-year survival rate of pancreatic cancer reported by Siewert, et al. and the 5-year survival rate of AEG reported by Marc Ychou, et al. Therefore, this study provided a new reference for predicting the survival rate after AEG.
Accurate prediction of surgical prognosis is important for informing subsequent treatment decisions of AEG patients. Currently, prognostic prediction of postoperative tumors is majorly based on logistic regression and Cox regression models [22,23]. The logistic regression model lacks survival time and, in terms of survival prediction, is inferior to the Cox regression model. In this study, the Cox-PH model was used to model and predict the survival rate of AEG, which showed better predictive outcomes. Construction of the Cox-PH model should satisfy the assumption of equal proportionality, therefore, some important prognostic factors should be discarded when constructing this model. The Cox-PH model is a linear regression, and its predictive outcomes should satisfy the linear regression equation, which cannot capture the interactions between features. Machine learning techniques can better capture the complex association between features [24], thereby improving the model’s accuracy. Previously, scholars [25] used artificial neural network (ANN) method to construct a machine learning model for predicting the prognosis of gastric cancer patients based on data of gastric cancer patients in local databases, but they only explored the predictive efficacy between the Union International Contra Cancrum (UICC) TNM classification system and ANN. The prediction model comprised 14 features and lacked some important preoperative clinical blood features, which reduced the usefulness and reliability of the model in clinical practice.
In this study, we used 19 clinical characteristics (gender, age, Borrmann staging, degree of differentiation, depth of infiltration (T stage), number of lymph node metastases (N stage), pathological TNM stage, maximum tumor diameter, postoperative chemotherapy, Fibr, D-dimer, surgical approach, postoperative hospital stay, PNI, NLR, WBR, CEA, AFP, and CA199) to construct Cox-PH models and four machine learning models to predict the 3- and 5-year survival status of patients. Among the 19 factors, the correlation between Fibr and D-dimer preoperative blood indicators with survival outcomes of gastric cancer patients has been reported [26]. Borrmann staging, degree of differentiation, depth of infiltration (T-stage), and the number of lymph node metastases (N stage), pathological TNM stage, and maximum tumor diameter have been shown to affect the prognosis of AEG patients [27-30]. The three clinical indices of infiltration depth (T stage), number of lymph node metastases (N stage), and pathological TNM stage have a high degree of overlap. To prevent overfitting of the machine learning model, two indices (infiltration depth and number of lymph node metastases) were excluded from the construction of the five models. In the construction of the machine learning models, cross-validation was performed in the training set for hyperparameter tuning, and each model showed its predictive efficacy. Combining the AUC values, calibration curves, and DCA curve performance of each model in the training and test set ROC curves, the XGBoost model exhibited the best performance with AUC values ≥ 0.80 in both the training and test sets. The Cox regression model also had a high predictive efficacy, however, limitations of its algorithm and the loss of important clinical features prevented it from being comparable to XGBoost. Therefore, the developed XGBoost model has a high clinical utility and reliability.
Limitations of this study
This was a single-center study with a small sample size. Machine learning models should be validated using large data sets to obtain more stable results [31]. The MLP in this study is a deep learning model, a subset of the ML model, an Artificial Neural Network (ANN) with a high ability to learn simulation of nonlinear feature data. However, the MLP did not have a good predictive ability, probably because the variable features were not effectively extracted and the amount of data was small. Therefore, in follow-up studies, large multi-center data should be used for the training and external validation tests to develop a more reliable prediction model. Second, factors that may affect the long-term prognosis of AEG patients, such as family history, smoking, and alcohol consumption, were not included in the 19 clinical observations. More factors that may affect the long-term prognostic outcomes of AEG should be included in subsequent model optimizations to continuously improve the prediction model. At the same time, the Cox proportional risk model and the four machine learning models are based on completely different statistical bases, this study focuses on the results of the comparison, but the possible bias in the comparison process cannot be ignored. Finally, this study was developed and validated using retrospective data, and prospective validation studies should also be conducted to confirm the reliability of the model before formal clinical applications.
In conclusion, we constructed a Cox-PH model and a machine learning model for predicting survival risk after AEG from 19 clinicopathological features commonly observed in clinical work, with the XGBoost model showing the best efficacy. This model provides an important reference for individualized prognostic assessment and postoperative treatment decisions of AEG.
Declarations
Ethics approval and consent to participate: Approval of the research protocol by an Institutional.
Reviewer board: The Ethics Committee of Bengbu Medical College approved the study.
Informed consent: All subjects provided informed consent to this study.
Consent for publication
Bengbu Medical College agrees to the publication of this article.
Availability of data and materials
All materials and data were provided by Bengbu Medical College.
Funding Information
This work was supported by 512 Talent Development Program Grant Numbers: by51202207
Authors’ contributions
Kaiji Gao led the study and wrote the paper and the other authors participated in the data collection and data analysis.
- Liu K, Yang K, Zhang W, Chen X, Chen X, Zhang B, Chen Z, Chen J, Zhao Y, Zhou Z, Chen L, Hu J. Changes of Esophagogastric Junctional Adenocarcinoma and Gastroesophageal Reflux Disease Among Surgical Patients During 1988-2012: A Single-institution, High-volume Experience in China. Ann Surg. 2016 Jan;263(1):88-95. doi: 10.1097/SLA.0000000000001148. PMID: 25647058; PMCID: PMC4679348.
- Imamura Y, Watanabe M, Toihata T, Takamatsu M, Kawachi H, Haraguchi I, Ogata Y, Yoshida N, Saeki H, Oki E, Taguchi K, Yamamoto M, Morita M, Mine S, Hiki N, Baba H, Sano T. Recent Incidence Trend of Surgically Resected Esophagogastric Junction Adenocarcinoma and Microsatellite Instability Status in Japanese Patients. Digestion. 2019;99(1):6-13. doi: 10.1159/000494406. Epub 2018 Dec 14. PMID: 30554205.
- Thrift AP, Whiteman DC. The incidence of esophageal adenocarcinoma continues to rise: analysis of period and birth cohort effects on recent trends. Ann Oncol. 2012 Dec;23(12):3155-3162. doi: 10.1093/annonc/mds181. Epub 2012 Jul 30. PMID: 22847812.
- Kusano C, Gotoda T, Khor CJ, Katai H, Kato H, Taniguchi H, Shimoda T. Changing trends in the proportion of adenocarcinoma of the esophagogastric junction in a large tertiary referral center in Japan. J Gastroenterol Hepatol. 2008 Nov;23(11):1662-5. doi: 10.1111/j.1440-1746.2008.05572.x. PMID: 19120859.
- Cox DR. Regression models and life-tables. JRoyStat SocSerB. Methodol.1972;34(2):187-220.
- Li L. Dimension reduction for high-dimensional data. Methods Mol Biol. 2010;620:417-34. doi: 10.1007/978-1-60761-580-4_14. PMID: 20652514.
- Kevin MP. Machine learning: a probabilistic perspective. MIT Press. 2012.
- Verma AA, Murray J, Greiner R, Cohen JP, Shojania KG, Ghassemi M, Straus SE, Pou-Prom C, Mamdani M. Implementing machine learning in medicine. CMAJ. 2021 Aug 30;193(34):E1351-E1357. doi: 10.1503/cmaj.202434. Epub 2021 Aug 29. PMID: 35213323; PMCID: PMC8432320.
- Lynch CM, Abdollahi B, Fuqua JD, de Carlo AR, Bartholomai JA, Balgemann RN, van Berkel VH, Frieboes HB. Prediction of lung cancer patient survival via supervised machine learning classification techniques. Int J Med Inform. 2017 Dec;108:1-8. doi: 10.1016/j.ijmedinf.2017.09.013. Epub 2017 Sep 25. PMID: 29132615; PMCID: PMC5726571.
- Zhou CM, Xue Q, Wang Y, Tong J, Ji M, Yang JJ. Machine learning to predict the cancer-specific mortality of patients with primary non-metastatic invasive breast cancer. Surg Today. 2021 May;51(5):756-763. doi: 10.1007/s00595-020-02170-9. Epub 2020 Oct 26. PMID: 33104877.
- Ji GW, Fan Y, Sun DW, Wu MY, Wang K, Li XC, Wang XH. Machine Learning to Improve Prognosis Prediction of Early Hepatocellular Carcinoma After Surgical Resection. J Hepatocell Carcinoma. 2021 Aug 10;8:913-923. doi: 10.2147/JHC.S320172. Erratum in: J Hepatocell Carcinoma. 2021 Oct 27;8:1297-1298. PMID: 34414136; PMCID: PMC8370036.
- Christopherson KM, Das P, Berlind C, Lindsay WD, Ahern C, Smith BD, Subbiah IM, Koay EJ, Koong AC, Holliday EB, Ludmir EB, Minsky BD, Taniguchi CM, Smith GL. A Machine Learning Model Approach to Risk-Stratify Patients With Gastrointestinal Cancer for Hospitalization and Mortality Outcomes. Int J Radiat Oncol Biol Phys. 2021 Sep 1;111(1):135-142. doi: 10.1016/j.ijrobp.2021.04.019. Epub 2021 Apr 29. PMID: 33933480.
- Nagtegaal ID, Odze RD, Klimstra D, Paradis V, Rugge M, Schirmacher P, Washington KM, Carneiro F, Cree IA; WHO Classification of Tumours Editorial Board. The 2019 WHO classification of tumours of the digestive system. Histopathology. 2020 Jan;76(2):182-188. doi: 10.1111/his.13975. Epub 2019 Nov 13. PMID: 31433515; PMCID: PMC7003895.
- Ji GW, Jiao CY, Xu ZG, Li XC, Wang K, Wang XH. Development and validation of a gradient boosting machine to predict prognosis after liver resection for intrahepatic cholangiocarcinoma. BMC Cancer. 2022 Mar 11;22(1):258. doi: 10.1186/s12885-022-09352-3. PMID: 35277130; PMCID: PMC8915487.
- Camp RL, Dolled-Filhart M, Rimm DL. X-tile: a new bio-informatics tool for biomarker assessment and outcome-based cut-point optimization. Clin Cancer Res. 2004 Nov 1;10(21):7252-9. doi: 10.1158/1078-0432.CCR-04-0713. PMID: 15534099.
- Chevallay M, Bollschweiler E, Chandramohan SM, Schmidt T, Koch O, Demanzoni G, Mönig S, Allum W. Cancer of the gastroesophageal junction: a diagnosis, classification, and management review. Ann N Y Acad Sci. 2018 Dec;1434(1):132-138. doi: 10.1111/nyas.13954. Epub 2018 Aug 23. PMID: 30138540.
- de Manzoni G, Pedrazzani C, Verlato G, Roviello F, Pasini F, Pugliese R, Cordiano C. Comparison of old and new TNM systems for nodal staging in adenocarcinoma of the gastro-oesophageal junction. Br J Surg. 2004 Mar;91(3):296-303. doi: 10.1002/bjs.4431. PMID: 14991629.
- Tytgat GN, Bartelink H, Bernards R, Giaccone G, van Lanschot JJ, Offerhaus GJ, Peters GJ. Cancer of the esophagus and gastric cardia: recent advances. Dis Esophagus. 2004;17(1):10-26. doi: 10.1111/j.1442-2050.2004.00371.x. PMID: 15209736.
- Fein M, Fuchs KH, Ritter MP, Freys SM, Heimbucher J, Staab C, Thiede A. Application of the new classification for cancer of the cardia. Surgery. 1998 Oct;124(4):707-13; discussion 713-4. doi: 10.1067/msy.1998.91363. PMID: 9780992.
- Rüdiger Siewert J, Feith M, Werner M, Stein HJ. Adenocarcinoma of the esophagogastric junction: results of surgical therapy based on anatomical/topographic classification in 1,002 consecutive patients. Ann Surg. 2000 Sep;232(3):353-61. doi: 10.1097/00000658-200009000-00007. PMID: 10973385; PMCID: PMC1421149.
- Ychou M, Boige V, Pignon JP, Conroy T, Bouché O, Lebreton G, Ducourtieux M, Bedenne L, Fabre JM, Saint-Aubert B, Genève J, Lasser P, Rougier P. Perioperative chemotherapy compared with surgery alone for resectable gastroesophageal adenocarcinoma: an FNCLCC and FFCD multicenter phase III trial. J Clin Oncol. 2011 May 1;29(13):1715-21. doi: 10.1200/JCO.2010.33.0597. Epub 2011 Mar 28. PMID: 21444866.
- Liu X, Guo W, Shi X, Ke Y, Li Y, Pan S, Jin Y, Wang Y, Ruan Q, Ma H. Construction and verification of prognostic nomogram for early-onset esophageal cancer. Bosn J Basic Med Sci. 2021 Dec 1;21(6):760-772. doi: 10.17305/bjbms.2021.5533. PMID: 33823125; PMCID: PMC8554706.
- Tang X, Zhou X, Li Y, Tian X, Wang Y, Huang M, Ren L, Zhou L, Ding Z, Zhu J, Xu Y, Peng F, Wang J, Lu Y, Gong Y. A Novel Nomogram and Risk Classification System Predicting the Cancer-Specific Survival of Patients with Initially Diagnosed Metastatic Esophageal Cancer: A SEER-Based Study. Ann Surg Oncol. 2019 Feb;26(2):321-328. doi: 10.1245/s10434-018-6929-0. Epub 2018 Oct 24. PMID: 30357578.
- Buch VH, Ahmed I, Maruthappu M. Artificial intelligence in medicine: current trends and future possibilities. Br J Gen Pract. 2018 Mar;68(668):143-144. doi: 10.3399/bjgp18X695213. PMID: 29472224; PMCID: PMC5819974.
- Mofidi R, Deans C, Duff MD, de Beaux AC, Paterson Brown S. Prediction of survival from carcinoma of oesophagus and oesophago-gastric junction following surgical resection using an artificial neural network. Eur J Surg Oncol. 2006 Jun;32(5):533-9. doi: 10.1016/j.ejso.2006.02.020. Epub 2006 Apr 18. PMID: 16618533.
- Repetto O, De Re V. Coagulation and fibrinolysis in gastric cancer. Ann N Y Acad Sci. 2017 Sep;1404(1):27-48. doi: 10.1111/nyas.13454. Epub 2017 Aug 22. PMID: 28833193.
- Gao A, Wang L, Li J, Li H, Han Y, Ma X, Sun Y. Prognostic Value of Perineural Invasion in Esophageal and Esophagogastric Junction Carcinoma: A Meta-Analysis. Dis Markers. 2016;2016:7340180. doi: 10.1155/2016/7340180. Epub 2016 Mar 8. PMID: 27051075; PMCID: PMC4802032.
- Shahbaz Sarwar CM, Luketich JD, Landreneau RJ, Abbas G. Esophageal cancer: an update. Int J Surg. 2010;8(6):417-22. doi: 10.1016/j.ijsu.2010.06.011. Epub 2010 Jun 30. PMID: 20601255.
- Yang J, Lu Z, Li L, Li Y, Tan Y, Zhang D, Wang A. Relationship of lymphovascular invasion with lymph node metastasis and prognosis in superficial esophageal carcinoma: systematic review and meta-analysis. BMC Cancer. 2020 Mar 4;20(1):176. doi: 10.1186/s12885-020-6656-3. PMID: 32131772; PMCID: PMC7057611.
- Gupta V, Coburn N, Kidane B, Hess KR, Compton C, Ringash J, Darling G, Mahar AL. Survival prediction tools for esophageal and gastroesophageal junction cancer: A systematic review. J Thorac Cardiovasc Surg. 2018 Aug;156(2):847-856. doi: 10.1016/j.jtcvs.2018.03.146. Epub 2018 Apr 12. PMID: 30011772.
- van der Ploeg T, Austin PC, Steyerberg EW. Modern modelling techniques are data hungry: a simulation study for predicting dichotomous endpoints. BMC Med Res Methodol. 2014 Dec 22;14:137. doi: 10.1186/1471-2288-14-137. PMID: 25532820; PMCID: PMC4289553.