
More Information
Submitted: November 05, 2025 | Approved: November 11, 2025 | Published: November 12, 2025
How to cite this article: Valenzuela RF, Duran-Sierra E, Antony M, Lo SLH, Amini B, Torres KE, et al. Pilot Study on Evaluating Multiparametric MRI (mp-MRI) Including Contrast-Enhanced Susceptibility Imaging (CE-SWI) in Predicting Pathology Treatment Response in Rhabdomyosarcoma. J Radiol Oncol. 2025; 9(3): 062-074. Available from:
https://dx.doi.org/10.29328/journal.jro.1001083
DOI: 10.29328/journal.jro.1001083
Copyright license: © 2025 Valenzuela RF, et al. This is an open access article distributed under the Creative Commons Attribution License, which permits unrestricted use, distribution, and reproduction in any medium, provided the original work is properly cited.
Keywords: Soft Tissue Sarcoma (STS); Rhabdomyosarcoma (RMS); Pathology-Assessed Treatment Effect (PATE); Multiparametric MRI (mp-MRI)
Abbreviations: ADC: Apparent Diffusion Coefficient; BL: Baseline; CE-SWI: Contrast-Enhanced Susceptibility-Weighted Imaging; DBMS: Database Management System; DCE: Dynamic Contrast Enhancement; DWI: Diffusion-Weighted Imaging; GLSZM: Gray-Level Size Zone Matrix; mp-MRI: multiparametric Magnetic Resonance Imaging; NAT: Neoadjuvant Therapy; NOS: Not Otherwise Specified; NR: Non-Responders; PATE: Pathology-Assessed Treatment Effect; PC: Post-Chemotherapy; PD: Progressive Disease; PR: Partial Responders; PRT: Post-Radiation Therapy; PS: Pre-Surgical; PWI: Perfusion-Weighted Imaging; R: Responders; RECIST: Response Evaluation Criteria In Solid Tumors; ROC: Receiver Operating Characteristic; STS: Soft Tissue Sarcoma; SWI: Susceptibility-Weighted Imaging; TIF: Treatment-Induced Fibrosis; TIH: Treatment-Induced Hemorrhage; TIN: Treatment-Induced Necrosis; T2*: T2-Star; UPS: Undifferentiated Pleomorphic Sarcoma; VOI: Volume Of Interest; WHO: World Health Organization

Pilot Study on Evaluating Multiparametric MRI (mp-MRI) Including Contrast-Enhanced Susceptibility Imaging (CE-SWI) in Predicting Pathology Treatment Response in Rhabdomyosarcoma
Raul F Valenzuela* , Elvis Duran-Sierra, Mathew Antony, Sam LH Lo, Behrang Amini, Keila E Torres, Dejka Araujo, Robert S Benjamin, Jingfei Ma, Ken P Hwang, R Jason Stafford, Chengyue Wu, John E Madewell, Jossue V Espinoza, William A Murphy Jr, Alfonso Cueto, Pia V Valenzuela, Charles Miranda-Zarate and Colleen M Costelloe
Houston, TX, USA
*Address for Correspondence: Raul F Valenzuela, Houston, TX, USA, Email: [email protected]
Background and purpose: Rhabdomyosarcoma (RMS) is the most common soft-tissue sarcoma in the pediatric population and an aggressive cancer subtyped as embryonal, alveolar, pleomorphic, or not otherwise specified (NOS). It demonstrates post-therapeutic hemosiderin deposition, granulation tissue formation, fibrosis, and calcification. This pilot study aims to provide initial evidence for developing a multiparametric MRI-feature-derived (mp-MRI) predictive response model to outperform RECIST.
Methods: A UT MD Anderson Cancer Center IRB-approved retrospective pilot study of 11 extremity and pelvic RMS patients with presurgical mp-MRI, including diffusion-weighted imaging (DWI), contrast-enhanced susceptibility-weighted imaging (CE-SWI), and perfusion-weighted imaging with dynamic-contrast-enhancement (PWI/DCE), with surgical resection between 02/2021-06/2024. Lesions were categorized into 6 CE-SWI and 6 PWI/DCE morphologic patterns. Time-intensity curves (TICs) were classified as types I-V. Patients were categorized by the percentage of pathology-assessed treatment effect (PATE) in the surgical specimen as responders (PATE> 90%, n = 3) and partial/non-responders (PATE < 90%, n = 8).
Results: The ADC-mean for the 6 extremity RMS increased minimally from 1,425 ± 476 x 10-6 mm2/s at baseline (BL) to 1,494 ± 386 x 10-6 mm2/s at the presurgical time point (PS). The ADC-mean for the 5 pelvic RMS increased from 1,093 ± 342 x 10-6 mm2/s at BL to 1,677 ± 313 x 10-6 mm2/s at PS. All responders and partial/non-responders presented presurgical RECIST, WHO, and volume stability. At PS, 50% of responders displayed CE-SWI Complete Ring pattern (p = 0.5578), PWI/DCE Capsular pattern (p = 0.6065), and TIC Type-2 (p = 0.6065). No statistically significant differences were observed at PS in ADC or CE-SWI first- or high-order radiomics and PWI/DCE semi-quantitative parameters comparing responders vs. partial/non-responders at PS. PS ROC Analysis: The model based on the CE-SWI textural radiomic GLSZM Large-Area-High-Gray-Level-Emphasis yielded perfect classification performance (AUC = 1.0) separating responders vs. partial/non-responders, outperforming other radiomic, morphologic, and qualitative features such as ADC-Maximum-2D-Diameter-Slice (0.83), CE-SWI Complete Ring (AUC = 0.67), PWI/DCE Capsular (0.67), RECIST (0.67), and TIC type-2 (0.6).
Conclusion: Our pilot study provides initial evidence supporting a model utilizing a single CE-SWI-derived high-order texture GLSZM radiomic feature that, in our small sample, obtained a perfect classification performance (AUC = 1.0), further building on the body of evidence supporting the use of mp-MRI with CE-SWI in soft-tissue sarcoma response assessment and suggesting its potential in predicting RMS response, outperforming RECIST (AUC = 0.67). These promising early results are hindered by a limited statistical power (10%) inherent to the small sample size and the retrospective nature of an exploratory pilot study, highlighting the necessity for further validation through a larger, more representative, and balanced prospective study.
Rhabdomyosarcoma (RMS) is a malignant tumor that develops from striated muscle or its precursor mesenchymal cells. It is rare in adults, accounting for only 3% of all soft-tissue sarcomas. In contrast, it is the most common soft-tissue sarcoma in children, representing over 50% of such cases, with 72% - 81% of patients being under 10 years old. RMS is a highly aggressive cancer, and the prognosis for adults is notably poorer than that for children [1].
Location
The extremities are the most frequent primary site for RMS in adults, accounting for 26% of cases. For pediatric and AYA (adolescent and young adults) patients, the most common site is the head and neck, specifically in the para meningeal region, which includes areas such as the middle ear, nasal cavity, paranasal sinuses, nasopharynx, infratemporal fossa, pterygopalatine fossa, and parapharyngeal region, comprising 25% of cases [1].
Subtypes
Rhabdomyosarcoma is classified into several subtypes, including embryonal (encompassing less common variants such as botryoid and spindle cell types), alveolar, and pleomorphic. Some cases may not fit into these classifications and are labeled as ‘not otherwise specified’ (NOS) [1]. The embryonal subtype (ERMS) is the most prevalent, accounting for 49% of cases, followed by the alveolar subtype at 30%. One-third of ERMS cases occur in children aged < 5 years. 4% of ERMSs affect infants. ERMSs also constitute 20% of all adult rhabdomyosarcomas. While embryonal and alveolar subtypes are predominantly found in children, adult cases often present with pleomorphic, spindle cell, and sclerosing variants [1]. The alveolar subtype (ARMS) is the second most common type of rhabdomyosarcoma, accounting for approximately 25% of these tumors.
ARMS occurs more commonly than embryonal rhabdomyosarcoma (ERMS) in the AYA population, with a peak incidence among individuals aged 10-25 and roughly equal incidence in male and female patients. ARMS most commonly arise in the extremities, trunk, and deep soft tissues. Other sites include the head, neck, paraspinal, and perineal regions. The pleomorphic subtype is typically found in the muscles of the extremities in adults over 45.
Treatment
The treatment of RMS generally involves a combination of chemotherapy, surgery, and radiation therapy. This multimodal approach is crucial for managing the primary tumor and potential metastases throughout the patient’s body [1]. After treatment, STS can exhibit reduced cellularity with degenerative cytological changes, necrosis, hyalinization, hemorrhage, hemosiderin deposition, and foamy macrophages. These findings help determine the percentage of pathology-assessed treatment effect (PATE). A high percentage of PATE is often considered a strong indicator of a favorable prognosis in sarcomas. Increased histologic necrosis after neoadjuvant therapy may lead to higher rates of R0 resection and facilitate limb salvage in tumors deemed unresectable [2-4].
While high percentages of therapy success rates can be observed among different RMS subtypes, the impact on overall outcomes remains a topic of debate. There is currently no definitive evidence showing significant differences in overall survival (OS) rates between responders and partial or non-responders. However, patients who achieve a complete response (CR) by the end of protocol therapy do exhibit significant improvements in failure-free survival (FFS) [5,6].
RMS and MRI
MRI is the preferred imaging method for evaluating primary RMS in most body sites. It provides additional benefits when used with diffusion-weighted imaging (DWI) and whole-body MRI for staging purposes. CT scans and FDG PET/CT are valuable for assessing nodal and metastatic disease. Imaging characteristics, such as a large and heterogeneous primary tumor, widespread lymphadenopathy, lung and bone metastases, as well as clinical findings, age, and tumor location, can help narrow down the differential diagnosis of rhabdomyosarcoma in adults [1].
Advantages of multiparametric MRI (mp-MRI)
Traditional methods for assessing tumor response, such as the Response Evaluation Criteria in Solid Tumors (RECIST) and the World Health Organization (WHO) criteria, as well as volumetric measurements, have limitations in accurately evaluating tumor response [7-9]. Typically based on conventional imaging, these methods focus on tumor size and morphology. Generally, RMS appears as a heterogeneously enhancing mass in the soft tissues and displays similar signal intensity to muscle on T1-weighted sequences, representing a diagnostic challenge. On T2-weighted sequences, central hyperintense regions can indicate necrosis or hemorrhage, which could lead to a misdiagnosis of a benign hematoma [10]. To overcome such limitations, mp-MRI, including DWI and dynamic contrast-enhanced imaging (DCE), provides a more comprehensive assessment of the tumor’s biology, including its cellularity and vascularity [11]. Susceptibility-weighted imaging (SWI) is sensitized to T2*-related signal contrast, providing valuable information about hemorrhage, fibrosis, and calcifications [12,13]. Using mp-MRI can help identify post-therapeutic histologic changes, such as the development of granulation tissue and fibrosis, which may be difficult to distinguish from viable tumor tissue using conventional imaging methods [10].
Purpose
This pilot study aims to gather initial evidence supporting the feasibility of developing a functional model that can establish RMS’s baseline imaging signature and predict pathologic treatment response, outperforming traditional size-based metrics such as RECIST (response evaluation criteria in solid tumors) by utilizing features extracted from multiparametric MRI (mp-MRI).
General disclosures
The included data collection, management, and processing methods followed the institutional clinical and research guidelines and regulations.
Institutional Review Board (IRB)
Due to the pilot study’s retrospective nature, the UT MD Anderson Cancer Center Institutional Review Board waived the need to obtain informed consent (IRB identifier PA16-0857 Protocol Name: “Utility of imaging of bone and soft tissue tumors and disease and treatment-related changes for diagnosis, prognosis, treatment response, and outcome”).
Data availability
The datasets used and analyzed during the current study are readily available from the corresponding author upon reasonable request.
Institutional MRI protocol
We performed functional mp-MRI sequences, including DWI/ADC, CE-SWI, and PWI/DCE [13,14]. The detailed acquisition parameters were tailored by vendor and field strength. During the preoperative treatment, multiple scans were acquired for each patient and compiled into 2 time points: baseline (BL, pre-therapy) and pre-surgical/completion of neoadjuvant therapy (NAT) (including post-systemic chemotherapy and post-radiotherapy). For patients with STS, we typically conduct a pre-therapy baseline study, one to three MRIs during systemic chemotherapy, and at least one post-radiation study one to two months after radiation therapy and immediately before surgical resection.
Patient population, inclusion, and exclusion criteria
The study analyzed 9,524 MRI scans performed for extremity and pelvic RMS in our institutional 29-magnet fleet (comprising 1.5T and 3.0T scanners from two manufacturers) between February 2021 and June 2024. Within this period, 81 RMS studies were completed, including pre-surgical primary tumor assessment and post-operative surveillance studies. We excluded all post-operative surveillance and cases without mp-MRI, resulting in 11 cases, including six extremity and five pelvic cases that underwent surgical resection with at least one pre-surgical MRI within the defined period. The average time between diagnosis and surgery for the 11 cases was 10 months. The study population ranged in age from 8 to 73 years, with an average age of 39 years (Table 1). Five were male (45%), and six were female (55%).
| Table 1: Summary of RMS patient demographics. | |
| Total Patients Included in Study | 11 |
| Total Extremity RMS Patients | 6 |
| Total Pelvic RMS Patients | 5 |
| Total Male | 5 (45%) |
| Total Female | 6 (55%) |
| Average Age | 39 years (range 8-73 years) |
| Responders ≥90%PATE) | 3 |
| Partial/Non-Responders (<90% PATE) | 8 |
| Total DWI/ADC Baseline (Pre-Treatment) Studies | 4 |
| Total PWI/DCE Baseline (Pre-Treatment) Studies | 4 |
| Total CE-SWI Baseline (Pre-Treatment) Studies | 2 |
| Total DWI/ADC Pre-Surgical Studies | 11 |
| Total PWI/DCE Pre-Surgical Studies | 7 |
| Total CE-SWI Pre-Surgical Studies | 6 |
Surgical specimen pathology assessment
In accordance with our institution’s standards for reporting the pathology-assessed treatment effect (PATE) of surgical specimens, which considers post-therapeutic necrosis, hemosiderin deposition, the formation of granulation tissue, fibrosis, and calcification, patients were divided into three groups. Tumors demonstrating PATE≥90% were classified as responders (R, n = 3), and tumors with PATE < 90% were labeled as partial/non-responders (PR/NR, n = 8) (Table 1). The extremity group demonstrated a preponderance of alveolar (2 cases), pleomorphic (2 cases), and spindle cell (2 cases) RMS, while the pelvic RMS series demonstrated a preponderance of embryonal RMS (3 out of 5 cases). Only 33% (2 cases: 1 alveolar and one spindle cell) of RMS of the extremities reached PATE≥90% (responders), while only 20% of pelvic RMS (one case of alveolar RMS) reached PATE≥90% (responders).
MRI exams
Baseline and pre-surgical mp-MRI scans were acquired for each of the 11 patients included in our study. At BL, four patients had DWI/ADC and PWI/DCE scans, and two had CE-SWI scans. At pre-surgical, 11 patients underwent DWI/ADC scans, seven PWI/DCE scans, and six CE-SWI scans (Table 1).
MRI storage and post-processing
MRI datasets were transferred to the institutional Picture Archiving and Communication System (IntelliSpace PACS, Philips, Amsterdam, the Netherlands). MR images were retrieved from the institutional database, and each tumor was manually contoured three-dimensionally (3D), creating a tumor Volume of Interest (VOI) segmentation. VOI segmentation provided a comprehensive representation of the total tumor, including all areas of necrosis and enhancing tumor, allowing for a more reliable tumor mapping than arbitrary 2-D ROI (region of interest) segmentation. Although manual segmentation is time-consuming and requires contouring by a trained Research Assistant (RA) and oversight by a senior radiologist, it is our preferred and most trusted method. No alternative effective automated segmentation method is currently available in our institution. Tumor size for all three orthogonal planes was registered for all time points and used to estimate RECIST, WHO, and volume data. MIM software version 7.1.4 (MIM Software Inc., Cleveland, USA) was used to outline, process, and generate VOIs from mp-MRI images. This manual 3D tumor segmentation process took approximately 60 minutes per patient. The segmented tumor VOI files were subsequently exported from MIM as RT-Struct files for further analysis using an in-house developed Cancer Radiomic and Perfusion Imaging (CARPI) automated framework [15], which is capable of extracting intensity histogram-based first- and high-order radiomic features from mp-MRI sequences. For DWI/ADC, no interpolation was performed before the computation of the radiomic features, as the exact ADC map resolution was standardized across all magnets. Discretization was performed with a fixed histogram bin width of 0.02531023 mm²/s, resulting in ADC values binned into approximately 100 bins. A total of 107 radiomic features were extracted from the CE-SWI and DWI/ADC tumor VOIs, including shape (14 features), first-order statistics (18 features), and texture (75 features). Specific details on the 107 volumetric radiomic features extracted by CARPI have been previously published [15]. CARPI also extracted semi-quantitative PWI/DCE parameters from time-intensity curves (TICs): Wash-in rate (WiR), wash-out rate (WoR), peak enhancement (PE), wash-in area under the curve (WiAUC), time-to-peak (TTP), wash-out area under the curve (WoAUC), and total area under the curve (AUC) [11,15].
Conventional size-based response assessment metrics
Maximum diameter (RECIST), multiplication of the longest and perpendicular cross-sectional diameters (WHO), and volumetric measurements were computed for all 11 patients at BL and PS, comparing responders and partial/non-responders. The RECIST, WHO, and volume criteria for the partial response (PR) threshold were set at 30%, 50%, and 50% decrease, respectively. The progressive disease (PD) threshold was set at 20%, 25%, and 25% increase, respectively [16].
PWI/DCE morphologic patterns and TICs
PWI/DCE images observed at PS were categorized into six groups: Capsular, Unipolar, Bipolar, Non-Nodular, Semi-Lunar, and Solid Enhancement [17]. In PWI/DCE, the TIC usually displays three stages of perfusion: 1) upslope, which reflects contrast wash-in; 2) plateau, which represents a steady state of contrast within the interstitial fluid but may not be visible in all lesions; and 3) downslope, which reflects contrast wash-out as gadolinium passes out of the tissues under examination. The TIC shape was subjectively assigned to one of five curve types based on its morphology by an experienced radiologist: Types I, II, III, IV, and V. Curves with rapid early/arterial upstroke, including TIC III, IV, and V, were considered “aggressive” curves [17].
CE-SWI morphologic patterns
CE-SWI images were categorized into six morphological patterns observed at PS, characterizing the distribution of T2* hypointensity throughout the tumor: Complete Ring, Full-Blooming, Globular, Incomplete Ring, Interstitial, and No-Blooming [18,19]. Responders and partial/non-responders were compared to identify the most frequently recurring patterns within each category.
Statistical analysis
One-way chi-squared tests were performed to assess the association of CE-SWI morphologic patterns, TIC curves, and PWI/DCE morphologic patterns with response. The radiomic features and semi-quantitative variables were compared in responders vs. partial/non-responders using two-tailed non-parametric Wilcoxon rank-sum tests. A receiver operating characteristic (ROC) analysis of the most relevant mp-MRI features was performed for discriminating responders from partial/non-responders. All statistical analyses were implemented in Python 3.10.13 using the SciPy library version 1.12.0 and the Scikit-Learn library version 1.4.1. Statistical significance was assessed at a 5% level (p < 0.05).
Statistical power analysis
The small sample size of this study (n = 11) due to the rarity of extremity and pelvic RMS tumors, yielded a statistical power of 0.102 (~10%) for detecting significant differences between responders (n = 3) and partial/non-responders (n = 8) with a medium effect size of 0.5 and a significance level of 5%.
DWI/ADC analysis
The mean ADC of the six extremity RMS patients (with an average age of 51 years) increased only minimally from 1,425 ± 476 x 10-6 mm2/s at BL to 1,494 ± 386 x 10-6 mm2/s at PS (Table 2). The mean ADC of the five pelvic RMS patients (with an average age of 26 years) increased from 1,093 ± 342 x 10-6 mm2/s at BL to 1,677 ± 313 x 10-6 mm2/s at PS (Table 2).
| Table 2: DWI/ADC analysis results comparing extremity vs. pelvic RMS patients at baseline and the pre-surgical time point (PS). | |||||||
| Extremity RMS Patients | |||||||
| Baseline | Pre-Surgical | ||||||
| # | Sex | Age | Histology | Anatomical Location | Mean ADC ± SD | Mean ADC ± SD | PATE (%) |
| (x10-6 mm2/s) | (x10-6 mm2/s) | ||||||
| 1 | M | 40 | Alveolar | Right Mid-Thigh | N/A | 1184 ± 466 | 90 |
| 2 | F | 72 | Spindle Cell | Left Thigh: Posterior | 1761 ± 550 | 1998 ± 582 | 95 |
| 3 | F | 56 | Spindle Cell | Proximal Lower Leg: Lateral | 1088 ± 278 | 1548 ± 424 | 30 |
| 4 | M | 73 | Pleomorphic | Lower leg: Anterolateral | N/A | 1086 ± 409 | 70 |
| 5 | M | 29 | Pleomorphic | Left Mid-Lower Leg: Posteromedial | N/A | 1901 ± 266 | 80 |
| 11 | F | 34 | Alveolar | Forearm | N/A | 1246 ± 310 | 20 |
| Average | 51 | 1425 ± 476 | 1494 ± 386 | ||||
| Pelvic RMS Patients | |||||||
| Baseline | Pre-Surgical | ||||||
| # | Sex | Age | Histology | Anatomical Location | Mean ADC ± SD | Mean ADC ± SD | PATE (%) |
| (x10-6 mm2/s) | (x10-6 mm2/s) | ||||||
| 6 | M | 22 | Embryonal | Urinary Bladder/Prostate | N/A | 1714 ± 350 | 70 |
| 7 | F | 24 | Alveolar | Pelvis Floor: Posterior | N/A | 1511 ± 347 | 90 |
| 8 | M | 8 | Embryonal | Prostate | N/A | 2208 ± 397 | 70 |
| 9 | F | 14 | Embryonal | Uterus | 1335 ± 258 | 1504 ± 186 | 50 |
| 10 | F | 61 | Spindle Cell | Left Perineum | 851 ± 268 | 1449 ± 784 | 5 |
| Average | 26 | 1093 ± 342 | 1677 ± 313 | ||||
Conventional size-based response assessment metrics
All responders and partial/non-responders presented RECIST, WHO, and volume stability at PS with respect to BL (Figure 1).
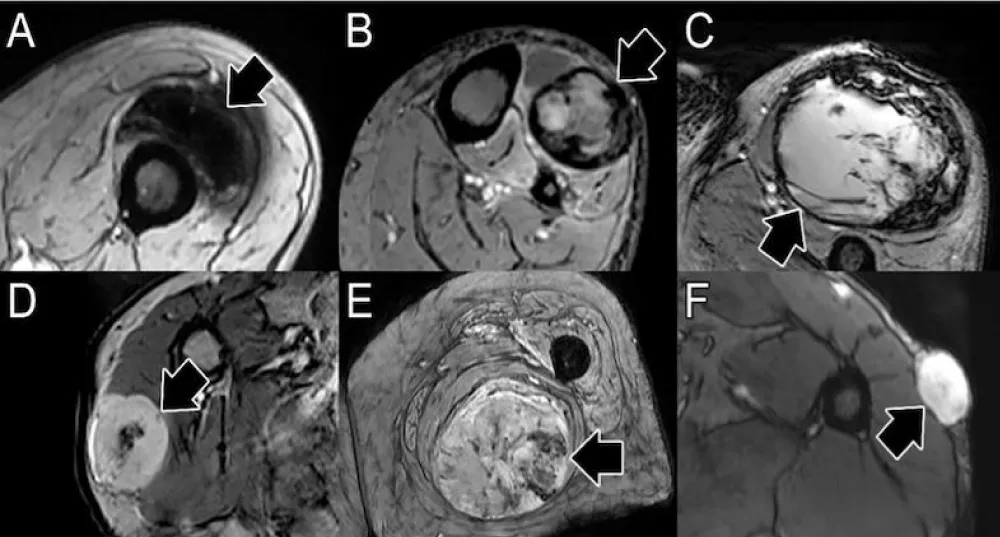
Figure 1: Conventional size-based response assessment metrics in RMS responders and partial/non-responders. The red and green horizontal lines indicate the thresholds for progressive disease (PD) and partial response (PR). Both responders and partial/non-responders fell in the range of stability at the PS time point, rendering RECIST, WHO, and Volumetric criteria unable to separate the two groups.
CE-SWI and PWI/DCE patterns
Figure 2 presents RMS’s observed CE-SWI and PWI/DCE patterns at BL and PS. At PS, 50% of responders displayed a Complete Ring pattern (p = 0.5578), Capsular pattern (p = 0.6065), and TIC Type 2 (p = 0.6065). Partial/non-responders mainly presented CE-SWI Incomplete Ring and No Blooming patterns, PWI/DCE Unipolar and Solid Enhancement patterns, and TIC types 3 and 5.
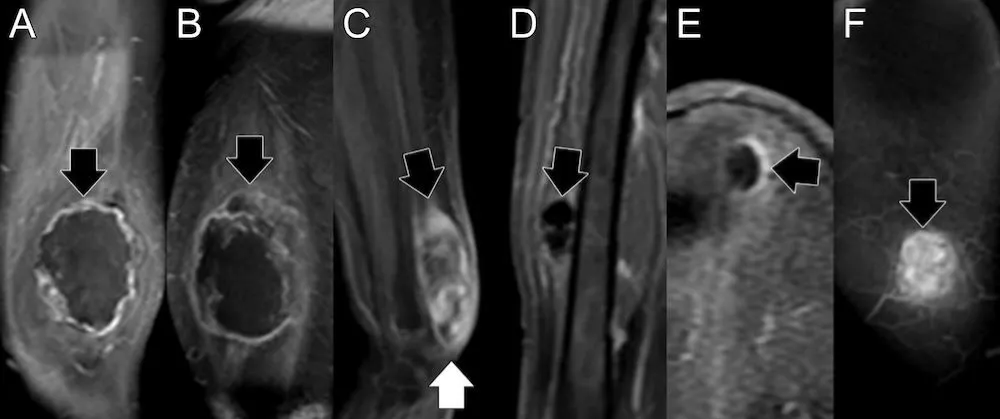
Figure 2: CE-SWI and PWI/DCE patterns were observed in RMS at baseline and PS. At PS, responders displayed a CE-SWI complete ring, a PWI/DCE capsular enhancement, and a TIC type 2 in 50% of cases.
DWI/ADC and CE-SWI first-order radiomics
At PS, responders displayed a 51% decrease in CE-SWI mean relative to BL (p = 0.2207), a 140% increase in skewness (p = 0.2207), a 232% increase in 10th percentile proportion (p = 1.0), and a 35% decrease in 90th percentile proportion (p = 1.0, Figure 3). The opposite trends were observed in CE-SWI mean, 10th, and 90th percentiles for partial and non-responders at PS compared to BL (Figure 3). No statistically significant differences were observed in ADC or CE-SWI first-order radiomics comparing responders vs. partial/non-responders at PS or BL.
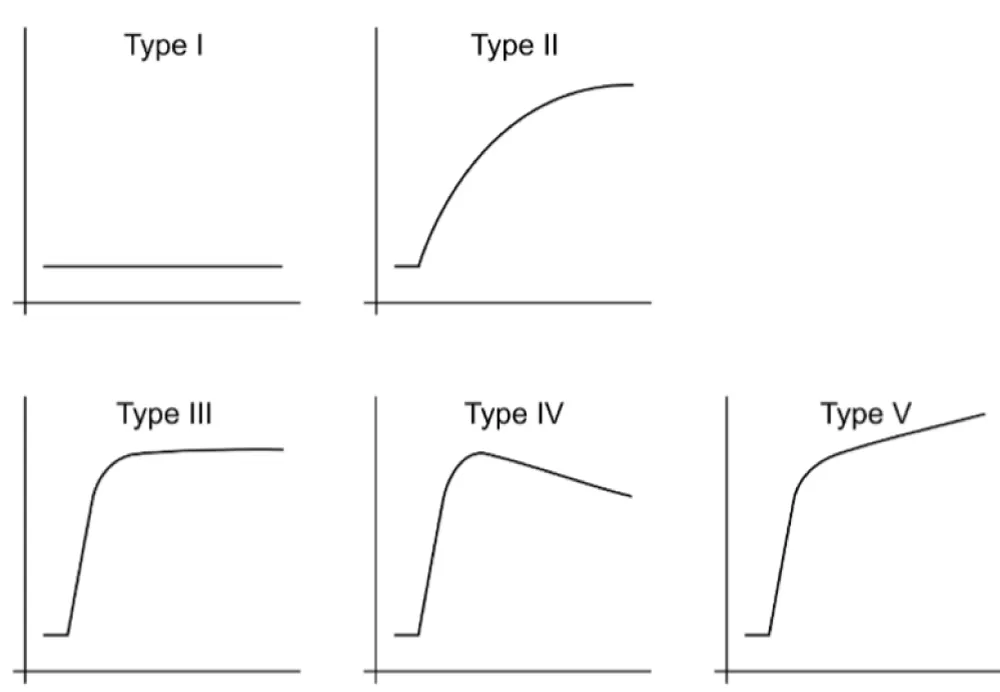
Figure 3: Means with 95% confidence intervals (error bars) of first-order radiomics of DWI/ADC and CE-SWI comparing responders vs. partial/non-responders. Decreased ADC skewness and 10th percentile, along with an increase in the 90th percentile, were observed not only in responders but also in partial/non-responders, rendering these findings unable to separate the two groups. An expected increase in the CE-SWI 10th percentile was observed in responders. Note: Due to the lack of variability, error bars are not shown for radiomic features that include only one patient (n = 1) in the analysis.
PWI/DCE semi-quantitative analysis
At pre-surgical (PS), no statistically significant differences were observed in PWI/DCE semi-quantitative parameters comparing responders vs. partial/non-responders (Figure 4).
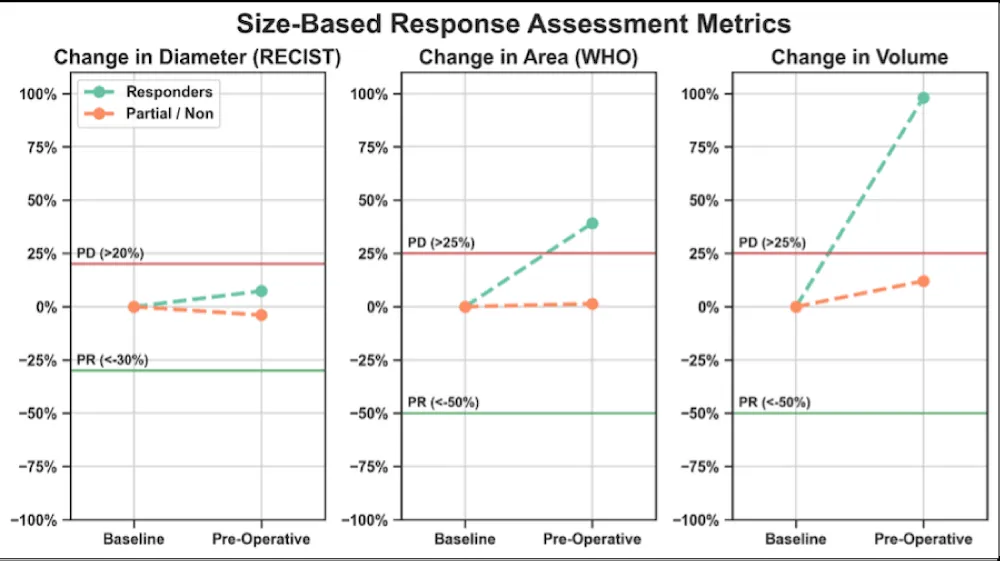
Figure 4: Boxplots of PWI/DCE semi-quantitative parameters comparing responders vs. partial/non-responders at PS. No semiquantitative feature displayed statistical significance separating responders from partial/non-responders.
High-order radiomics
At pre-surgical (PS), no statistically significant differences were observed in DWI/ADC or CE-SWI high-order radiomic features comparing responders vs. partial/non-responders (Figure 5).
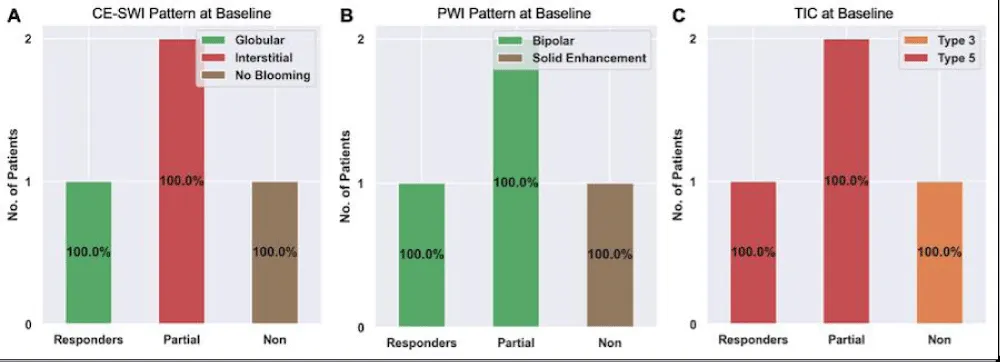
Figure 5: High-order radiomic features from DWI/ADC and CE-SWI comparing responders vs. partial/non-responders at PS. No DWI/ADC or CE-SWI higher-order radiomic feature displayed statistical significance separating responders from partial/non-responders.
ROC analysis at PS
The model based on the single high-order CE-SWI GLSZM texture feature, Large Area High Gray Level Emphasis, yielded perfect classification performance (AUC = 1.0, Figure 6) in separating responders vs. partial/non-responders, outperforming models based on ADC Maximum 2D Diameter Slice (AUC = 0.83), CE-SWI Complete Ring (AUC = 0.67), PWI/DCE Capsular (AUC = 0.67), RECIST Diameter (AUC = 0.67), and PWI/DCE TIC type 2 (AUC = 0.6).
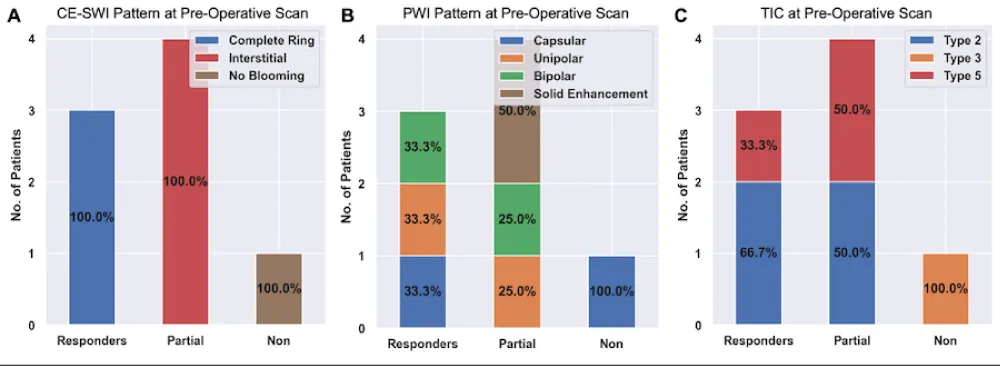
Figure 6: ROC analysis of classification models based on the most relevant mp-MRI features comparing responders vs. partial/non-responders at PS. Notably, although CE-SWI GLSZM Large-Area-High-Gray-Emphasis only demonstrated a p = 0.41 separating responders from partial/non-responders, it was able to display an AUC of 1.0 at the ROC analysis, as the single best feature-based model of RMS response prediction.
ADC and histology
The largest pediatric rhabdomyosarcoma (RMS) case series available during our research reported that patients with RMS exhibited the lowest mean apparent diffusion coefficient (ADC) values, which were statistically significantly lower than those of other malignant tumors that can occur in the head and neck region, such as mucoepidermoid carcinoma. The mean ADC values for RMS ranged from 0.78 to 1.21 × 10⁻³ mm²/s [20]. They established that an ADC threshold of 1.16 × 10⁻³ mm²/s could differentiate RMS from benign tumors such as infantile hemangioma, achieving an area under the curve of 1.0, strongly suggesting that ADC values obtained from diffusion-weighted MRI can help distinguish benign from malignant orbital pediatric tumors, as is the case in orbital infantile hemangiomas from rhabdomyosarcomas, respectively [21]. Our findings indicated that the average ADC for both extremity and pelvic RMS cases was higher at the end of therapy, specifically at the pre-surgical (PS) stage, compared with baseline (BL). These findings suggest a treatment-induced reduction in cellularity, indicating a positive response to treatment. Representative pre-treatment (baseline) and pre-surgical ADC images from one RMS patient, shown in Figure 7, illustrate a right-sided ADC intensity histogram with a higher mean and lower skewness at the PS stage.
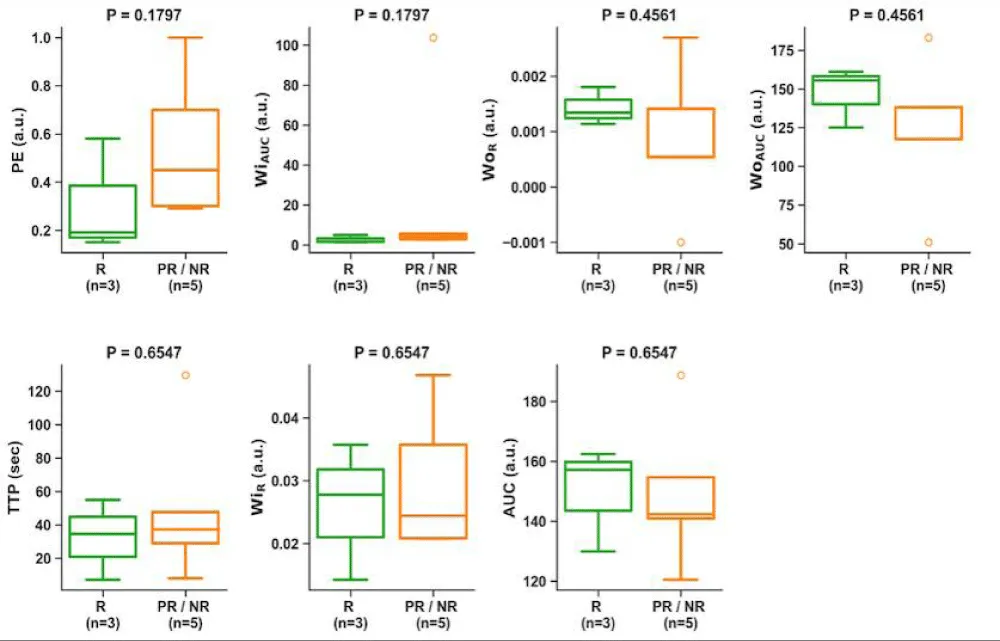
Figure 7: Botryoid Embryonal RMS: A.B. Baseline - Sagittal and axial T2-weighted images, along with an axial ADC map, reveal a large prostatic mass that protrudes into the bladder, exhibiting heterogeneous T2 signal and low ADC values. The corresponding ADC intensity histogram (B) is skewed to the left (positive), indicating high cellularity with a low ADC mean value. C.D. After treatment, sagittal and axial T2-weighted images and an axial ADC map show that the mass has decreased in size and increased ADC values. The corresponding ADC intensity histogram (D) displays right-sided (negative) skewness, indicating a reduction in cellularity and increased water content associated with necrosis, resulting in an increased ADC mean. Overall, the reduction in skewness and the increase in ADC-mean indicate a decrease in cellularity, consistent with a positive response to treatment.
These first-order radiomic indicators point to a reduction in cellularity and an increase in necrosis, further supporting a positive response to neoadjuvant therapy. These findings align with published results on a comparable soft-tissue sarcoma (STS), including responding undifferentiated pleomorphic sarcoma (UPS), which also demonstrated an increased mean ADC and decreased skewness following successful therapy [22].
ADC and segmentation
DWI studies in pediatric sarcoma have employed various segmentation strategies, which can result in vastly different ADC measurements. This highlights the importance of further investigating and standardizing segmentation methods [23]. In pediatric RMS, the volumetric determination (VOI) of tumor ADC (ADC histogram analysis) appears to be more reproducible and a better reflector of lesion heterogeneity than cross-sectional analysis of a single region of interest (ROI), as the latter may introduce selection bias, which is not present in the former. Our preferred method for segmentation via VOI effectively captures the full heterogeneity of the tumor by volumetrically segmenting the entire lesion. This approach encompasses all tumor components, including cellular and necrotic fractions, as illustrated by the distribution of voxels across the tumor’s intensity histogram, which additionally helps normalize ADC measurement variations that may occur between different scanners [15]. Whole-lesion ADC histogram analysis of embryonal RMS demonstrates higher ADC values in comparison with most cellular malignant tumors or more cellular RMS due to the presence of internal necrosis and myxoid components [24]. In our series, the only available baseline ADC measurement of embryonal RMS demonstrated an ADC mean of 1335 ± 258 (Table 2), aligning with the relatively high ADC values described in the literature for treatment-naïve ERMS [24].
ADC and hemorrhage
We noted that the post-therapeutic increase in ADC mean in extremity cases is less significant (2% or less) compared to pelvic cases (approximately 50%), which may correlate with the observation that extremity RMS may display spontaneous and treatment-induced hemorrhage more commonly. Such observation stems from the analysis of CE-SWI sequences available for the extremity cases and T2-WI sequences available for the pelvic cases. We can theorize that the difference in hemorrhage rates between extremity and pelvic RMS could be related to intrinsic biological differences among groups, including the preponderance of water-rich high ADC RMS in the pelvis, such as Embryonal types [24]. In contrast, there is a preponderance of more cellular types such as Alveolar, Spindle cell, and Pleomorphic RMS in the extremities [1]. Hemorrhage and its T2* susceptibility effect may hinder the expected post-treatment ADC rise driven by the reduction of cellularity. Such oppositional phenomena have been previously described in other cellular soft-tissue sarcomas, such as UPS [14]. In other words, the observed relatively non-significant ADC-mean rise seen in extremity RMS responders at PS from BL (Figure 3) may likely be explained by treatment-induced hemorrhage (TIH), concurrently driving down ADC and CE-SWI mean values due to a preponderance of T2* hypo intensity that can oppose and mask the expected effect of treatment-induced ADC rise due to reduced cellularity, typically observed in a non-hemorrhagic responding malignancy [14].
ADC and PATE
As shown in pediatric patients with RMS, high tumor volume, high 18F-FDG uptake, and restricted diffusion can predict treatment outcomes. In a study published by Maennlin, et al. [25], combining PET and MRI, RMS tissue displaying SUV ≤ 2.5 and ADC ≥ 1,000 × 10–6 mm2/s was considered as “possible necrosis.” After chemotherapy, the estimated tumor necrosis increased from 36.3% of the total tumor volume to 70.6% [25]. Compared to our series, the proportion of cases that achieved high ADC values with a treatment-induced effect ≥ 90% (PATE) was only 3 cases (27%). In our study, the average PATE of the extremity RMS cases was 64%, and of the pelvic cases, 57%. Contrary to prior results, our analysis shows baseline responders displaying a higher mean ADC (1.761 × 10⁻³ mm2/s) than non/partial responders (1.091 × 10⁻³ mm2/s). These spurious results are likely driven by the scarcity of ADC measurements available in baseline studies (only 36% of cases).
PWI/DCE
Although it has been demonstrated that marginal-to-no significant differences were found in semiquantitative analysis, including PWI/DCE time-to-peak enhancement, maximum enhancement, and time-intensity curve types between RMS and sinonasal carcinomas in adults, the ADCs of sinonasal RMS can be significantly lower than those of sinonasal carcinomas [26]. Our findings also indicated that semiquantitative PWI/DCE metrics were unable to distinguish responders from partial/non-responders. Nonetheless, using morphologic and qualitative PWI/DCE patterns, half of the RMS responders display a PWI/DCE Capsular pattern and TIC type 2 at PS. In contrast, partial/non-responders mostly display Unipolar and Solid Enhancement patterns with TIC types 3 and 5 (Figure 2). Representative examples of these morphological patterns are shown in Figure 8. These findings agree with the previously reported Capsular and TIC type 2 PWI/DCE patterns observed in UPS responders in the post-radiotherapy assessment [17].
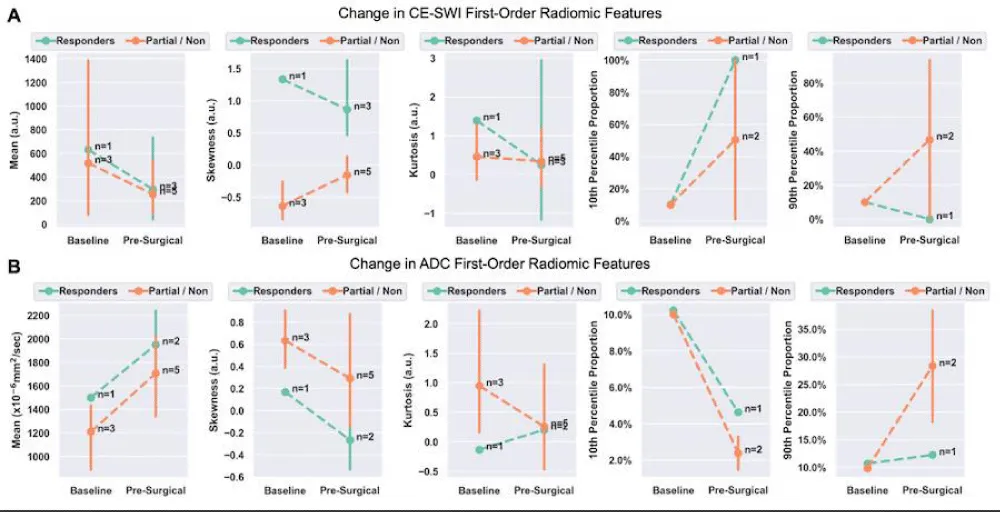
Figure 8: Representative pre-surgical PWI/DCE morphologic patterns of response in RMS patients and their correlation with PATE. A. Capsular with 90% PATE. B. Solid Enhancement with 5 % PATE. C. Unipolar with 70% PATE. PATE: pathology-assessed treatment effect.
CE-SWI
Susceptibility-weighted imaging (SWI) is a 3D high-spatial-resolution, velocity-corrected gradient-echo MRI sequence. It creates images with magnitude and filtered-phase information and uses tissue magnetic susceptibility differences to generate signal contrast [12]. The signal arises from paramagnetic (hemosiderin), diamagnetic (minerals and calcifications), and ferromagnetic (metal) molecules, resulting in a loss of signal that can be analyzed for patterns [12,27]. Our findings displayed that responders present a CE-SWI Complete Ring pattern at PS, while partial/non-responders mainly demonstrate Incomplete Ring and Globular patterns. Representative RMS patients presenting these patterns of response are shown in Figure 9. A pre-surgical complete ring pattern has also been reported as a biomarker of response in previous studies, including those of patients with UPS and LMS [19,28]. These CE-SWI patterns are most commonly observed at the endpoint of therapy, when treatment-induced necrosis, fibrosis, and hemorrhage have led to the formation of a ring-like fibrous and hemosiderin-rich tumor capsule, characterized by distinct and profound T2* peripheral hypointensity [19]. The present study and previous publications regarding UPS, LMS, and desmoid tumors highlight the utility of CE-SWI in assessing soft tissue tumors [19,28,29].
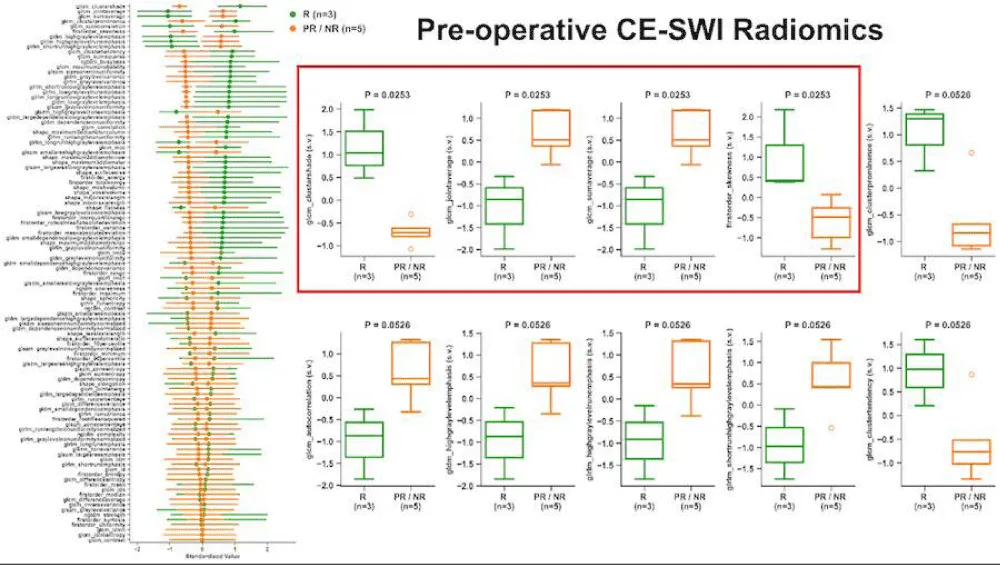
Figure 9: CE-SWI patterns observed pre-surgically and their correlation with PATE. A. Complete ring with 90% PATE. B. Incomplete ring with 70% PATE. C. Globular pattern with 30% PATE. PATE: pathology-assessed treatment effect.
Our mp-MRI protocol includes not only PWI/DCE and DWI/ADC but also CE-SWI sequences, which add no more than 5 minutes to the routine mp-MRI protocol, totaling around 35-40 minutes. Altogether, this provides valuable insights into the tumor’s nature and its response to treatment. As a result, mp-MRI, including CE-SWI, has been incorporated into our current institutional routine for extremity tumor MRI protocols, allowing clinicians and radiologists from our institution to become familiar with it over the last four years.
Our pilot study results suggest that observing mp-MRI features at the pre-surgical/end-of-NAT, including a CE-SWI Complete Ring pattern, increased ADC values, PWI/DCE Capsular pattern, and TIC type 2, can potentially identify RMS patients who have been successfully treated with a PATE of > 90% (Figure 10). From the first-order radiomic analysis, a decreased ADC skewness and 10th percentile, along with an increase of 90th percentile and an expected rise in CE-SWI 10th percentile, were observed in responders; nonetheless, no statistical significance was reached to separate responders from partial/non-responders, as observed in other soft-tissue sarcomas such as UPS [17,19,22].
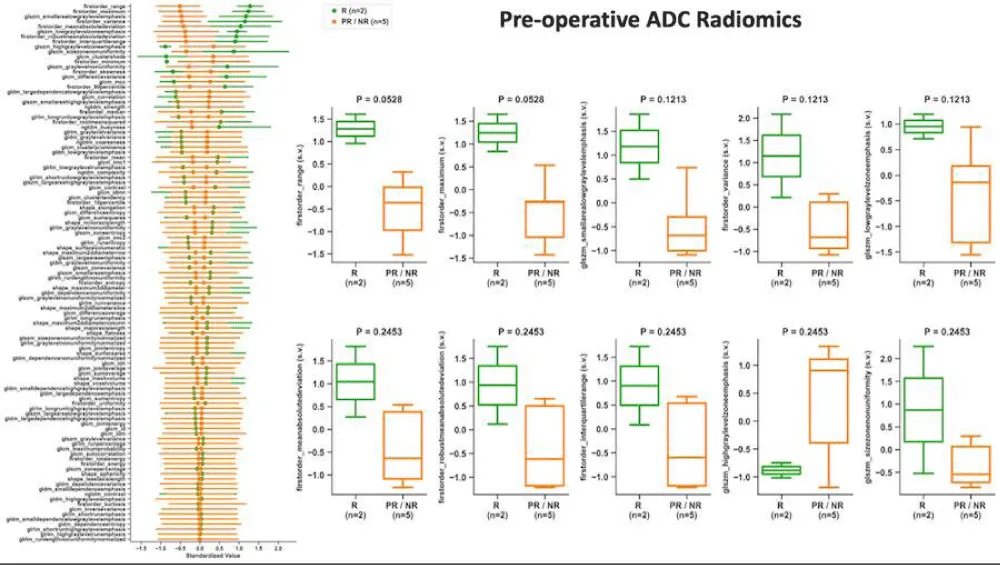
Figure 10: Representative RMS patient with 90% PATE. A.B. Axial CE-SWI shows a complete ring pattern. The corresponding CE-SWI intensity histogram (B) displays a left-sided intensity histogram curve with higher skewness and a higher number of voxels at the 10th percentile. The C.D. Axial ADC map shows low ADC values. The corresponding ADC intensity histogram (D) is skewed to the left (positive). The presence of the blood component in the post-treatment may contribute to non-tumoral restricted diffusion. E. The mass has a capsular pattern in PWI/DCE with TIC type 2.
The small sample size inherent in the exploratory nature of this pilot study hinders its statistical power. Although CE-SWI GLSZM texture feature; Large-Area-High-Gray-Level-Emphasis, did not reach significant statistical separation of responders from partial/non-responders (p = 0.41); in the ROC analysis at PS, such texture feature yielded a perfect classification performance (AUC = 1.0) in separating responders from partial/non-responders, outperforming models based on ADC Maximum 2D Diameter Slice (AUC = 0.83), CE-SWI Complete Ring (AUC = 0.67), PWI/DCE Capsular (AUC = 0.67), RECIST Diameter (AUC = 0.67), and PWI/DCE TIC type 2 (AUC = 0.6). Therefore, selected high-order radiomic features from pre-surgical CE-SWI can potentially represent novel, reliable imaging biomarkers for response assessment in extremity and pelvic RMS patients. These findings align with our published findings on undifferentiated pleomorphic sarcoma (UPS) and Leiomyosarcoma (LMS), where different post-therapeutic morphologic, qualitative, semiquantitative, first– and high–order radiomic features either derived from Diffusion Imaging (DWI/ADC), Perfusion Imaging (PWI/DCE) and/or contrast-enhanced susceptibility (CE – SWI) provided information to formulate a response model capable of discriminating responders from partial and non-responders [17,22,28,30].
The use of multiparametric MRI in a clinical setting is generally safe for patients, as it is non-invasive and does not utilize ionizing radiation. However, some potential risks exist due to the equipment’s magnetic fields, machine structure, and gadolinium contrast agents [31]. Therefore, only experienced and properly trained healthcare professionals should operate the MRI equipment to mitigate potential risks to patients. Additionally, artificial intelligence solutions, particularly those based on deep learning, are under development to improve radiological procedures and patient safety [32]. Examples include the reconstruction of undersampled images, artifact removal, including those derived from unintentional patient movement, and a reduction of up to 80% - 90% in gadolinium dose. Nevertheless, these solutions present limited generalizability, a lack of external validation, insufficient explainability of the models, and opacity in decision-making [32].
Study limitations
The present study was designed and conducted as an exploratory, early pilot investigation to assess the value of multiparametric imaging feature signatures, including CE-SWI, in the baseline/treatment-naïve tumors and to predict RMS end-of-therapy response. The relatively small study sample size (n = 11), retrospective design, and variability between patient treatments and MRI scanners limit the reproducibility of our findings. The perfect classification performance (AUC = 1.0) for CE-SWI GLSZM Large-Area-High-Gray-Emphasis may reflect overfitting due to the limited sample size and suggesting the need for further validation in a larger, prospective study. Hence, future studies with a larger and more balanced RMS patient cohort will be necessary to further validate these promising findings from the early study. Subsequent studies may investigate the use of mp-MRI features in conjunction with machine learning models to automatically and objectively assess RMS patient response. Nonetheless, the proposed mp-MRI-derived model for RMS response prediction demonstrated the potential to outperform conventional size-based metrics such as RECIST, WHO, and volumetric measurements in predicting treatment-induced histopathologic changes and overall treatment effectiveness in RMS.
Our exploratory pilot study results suggest that features derived from mp-MRI, including CE-SWI, can be valuable for assessing treatment responses in rhabdomyosarcoma (RMS). A pre-surgical model that utilized a single CE-SWI high-order radiomic texture feature GLSZM Large-Area-High-Gray-Level-Emphasis achieved perfect classification performance (AUC = 1.0) in differentiating responders from partial or non-responders. The CE-SWI-based texture radiomic model, and to a lesser degree, the recognition of the CE-SWI Complete Ring, can suggest successful treatment outcomes in RMS with a treatment effect of over 90% PATE. This model appears more effective than RECIST in predicting response. In the RMS treatment assessment, CE-SWI outperforms RECIST. The predictive value of DWI/ADC and PWI/DCE is also outlined. Comparable results have been described in undifferentiated pleomorphic sarcomas (UPS) and leiomyosarcomas (LMS). The small sample size of the present pilot study hinders the possibility of demonstrating statistically significant results. A prospective study with a larger sample size will be necessary to validate these promising results further.
Institutions that have not yet incorporated CE-SWI into their tumor MRI protocols could consider developing and including CE-SWI. This pilot study, in conjunction with previous publications on UPS, LMS, and desmoid tumors, builds on the growing body of evidence supporting the utility of mp-MRI and CE-SWI in assessing various subtypes of soft tissue tumors.
Acknowledgment
• The John S. Dunn, Sr. Distinguished Chair in Diagnostic Imaging
• M.R. Evelyn Hudson Foundation Endowed Professorship
- Saboo SS, Krajewski KM, Zukotynski K, Howard S, Jagannathan JP, Hornick JL, et al. Imaging features of primary and secondary adult rhabdomyosarcoma. Am J Roentgenol. 2012;199(6):W694–W703. Available from: https://doi.org/10.2214/ajr.11.8213
- Wardelmann E, Haas RL, Bovée JV, Terrier P, Lazar A, Messiou C, et al. Evaluation of response after neoadjuvant treatment in soft tissue sarcomas: the European Organization for Research and Treatment of Cancer–Soft Tissue and Bone Sarcoma Group (EORTC–STBSG) recommendations for pathological examination and reporting. Eur J Cancer. 2016;53:84–95. Available from: https://doi.org/10.1016/j.ejca.2015.09.021
- Soldatos T, Ahlawat S, Montgomery E, Chalian M, Jacobs MA, Fayad LM. Multiparametric assessment of treatment response in high-grade soft-tissue sarcomas with anatomic and functional MR imaging sequences. Radiology. 2016;278(3):831–840. Available from: https://doi.org/10.1148/radiol.2015142463
- Tsagozis P, Brosjö O, Skorpil M. Preoperative radiotherapy of soft-tissue sarcomas: surgical and radiologic parameters associated with local control and survival. Clin Sarcoma Res. 2018;8:1–7. Available from: https://doi.org/10.1186/s13569-018-0106-x
- Rosenberg AR, Anderson JR, Lyden E, Rodeberg DA, Wolden SL, Kao SC, et al. Early response as assessed by anatomic imaging does not predict failure-free survival among patients with Group III rhabdomyosarcoma: a report from the Children’s Oncology Group. Eur J Cancer. 2014;50(4):816–823. Available from: https://doi.org/10.1016/j.ejca.2013.11.031
- Nakazawa MS, Livingston JA, Zarzour MA, Bishop AJ, Ratan R, Ludwig JA, et al. Clinical characteristics and outcomes of adult alveolar rhabdomyosarcoma patients on first-line systemic therapies: a single-institution cohort. Rare Tumors. 2024;16. Available from: https://doi.org/10.1177/20363613241271669
- Fletcher CDM, Bridge JA, Hogendoorn PCW, Mertens F. WHO classification of tumours of soft tissue and bone. 4th ed. Lyon: IARC; 2013. p. 201–213. Available from: https://doi.org/10.1097/pat.0000000000000050
- Sbaraglia M, Bellan E, Dei Tos AP. The 2020 WHO classification of soft tissue tumours: news and perspectives. Pathologica. 2021;113(2):70. Available from: https://doi.org/10.32074/1591-951x-213
- Eisenhauer EA, Therasse P, Bogaerts J, Schwartz LH, Sargent D, Ford R, et al. New response evaluation criteria in solid tumours: revised RECIST guideline (version 1.1). Eur J Cancer. 2009;45(2):228–247. Available from: https://doi.org/10.1016/j.ejca.2008.10.026
- Crago AM, Cardona K, Koseła-Paterczyk H, Rutkowski P. Management of myxofibrosarcoma and undifferentiated pleomorphic sarcoma. Surg Oncol Clin N Am. 2022;31(3):419–430. Available from: https://doi.org/10.1016/j.soc.2022.03.006
- Subhawong TK, Wilky BA. Value added: functional MR imaging in management of bone and soft tissue sarcomas. Curr Opin Oncol. 2015;27(4):323–331. Available from: https://doi.org/10.1097/cco.0000000000000199
- Haacke EM, Reichenbach JR. Susceptibility weighted imaging in MRI: basic concepts and clinical applications. Hoboken: John Wiley & Sons; 2014. Available from: https://onlinelibrary.wiley.com/doi/book/10.1002/9780470905203
- Valenzuela RF, Madewell JE, Kundra V, Costelloe CM. Advanced imaging in musculoskeletal oncology: moving away from RECIST and embracing advanced bone and soft tissue tumor imaging (ABASTI) – Part I: tumor response criteria and established functional imaging techniques. Semin Ultrasound CT MR. 2021;42(1):3–12. Available from: https://doi.org/10.1053/j.sult.2020.08.013
- Valenzuela RF, Amini B, Duran-Sierra E, Canjirathinkal MA, Madewell JE, Costelloe CM, et al. Multiparametric MRI for the assessment of treatment effect and tumor recurrence in soft-tissue sarcoma of the extremities. J Radiol Oncol. 2023;7(3):58–65. Available from: https://www.radiooncologyjournal.com/index.php/jro/article/view/jro-aid1055
- Sierra ED, Valenzuela R, Canjirathinkal MA, Costelloe CM, Moradi H, Madewell JE, et al. Cancer radiomic and perfusion imaging automated framework: validation on musculoskeletal tumors. JCO Clin Cancer Inform. 2024;8:e2300118. Available from: https://doi.org/10.1200/cci.23.00118
- Subhawong TK, Feister K, Sweet K, Alperin N, Kwon D, Rosenberg A, et al. MRI volumetrics and image texture analysis in assessing systemic treatment response in extra-abdominal desmoid fibromatosis. Radiol Imaging Cancer. 2021;3(4):e210016. Available from: https://doi.org/10.1148/rycan.2021210016
- Valenzuela R, Duran-Sierra E, Canjirathinkal M, Amini B, Torres KE, Benjamin RS, et al. Perfusion-weighted imaging with dynamic contrast enhancement (PWI/DCE) morphologic, qualitative, semiquantitative, and radiomics features predicting undifferentiated pleomorphic sarcoma (UPS) treatment response. Sci Rep. 2024;14(1):21681. Available from: https://doi.org/10.1038/s41598-024-72780-7
- Valenzuela RF, Amini B, Duran-Sierra E, Canjirathinkal M, Idrees H, Madewell J, Costelloe C, Murphy W. Susceptibility-weighted imaging (SWI) in benign and malignant tumors of the musculoskeletal system. Eur Congr Radiol. 2023. Available from: https://epos.myesr.org/poster/esr/ecr2023/C-19005
- Valenzuela RF, Duran-Sierra EJ, Canjirathinkal MA, Amini B, Hwang KP, Ma J, et al. Novel use and value of contrast-enhanced susceptibility-weighted imaging morphologic and radiomic features in predicting extremity soft tissue undifferentiated pleomorphic sarcoma treatment response. JCO Clin Cancer Inform. 2025;9:e2400042. Available from: https://doi.org/10.1200/cci.24.00042
- Norman G, Fayter D, Lewis-Light K, McHugh K, Levine D, Phillips B, et al. Mind the gap: extent of use of diffusion-weighted MRI in children with rhabdomyosarcoma. Pediatr Radiol. 2015;45:778–781. Available from: https://doi.org/10.1007/s00247-014-3120-z
- Kralik SF, Haider KM, Lobo RR, Supakul N, Calloni SF, Soares BP. Orbital infantile hemangioma and rhabdomyosarcoma in children: differentiation using diffusion-weighted magnetic resonance imaging. J AAPOS. 2018;22(1):27–31. Available from: https://doi.org/10.1016/j.jaapos.2017.09.002
- Valenzuela R, Duran-Sierra E, Canjirathinkal M, Amini B, Torres KE, Benjamin RS, et al. Radiomics by quantitative diffusion-weighted MRI for predicting response in patients with extremity soft-tissue undifferentiated pleomorphic sarcoma. J Radiol Oncol. 2024;8(2):64–71. Available from: https://doi.org/10.29328/journal.jro.1001066
- Chatziantoniou C, Schoot RA, van Ewijk R, van Rijn RR, Ter Horst SAJ, et al. Methodological considerations on segmenting rhabdomyosarcoma with diffusion-weighted imaging—what can we do better? Insights Imaging. 2023;14(1):19. Available from: https://doi.org/10.1186/s13244-022-01351-z
- Inarejos Clemente EJ, Navallas M, Barber Martínez de la Torre I, Suñol M, Munuera Del Cerro J, Torner F, et al. MRI of rhabdomyosarcoma and other soft-tissue sarcomas in children. Radiographics. 2020;40(3):791–814. Available from: https://doi.org/10.1148/rg.2020190119
- Maennlin S, Chaika M, Gassenmaier S, Grimm R, Sparber-Sauer M, Fuchs J, et al. Evaluation of functional and metabolic tumor volume using voxel-wise analysis in childhood rhabdomyosarcoma. Pediatr Radiol. 2023;53(3):438–449. Available from: https://doi.org/10.1007/s00247-022-05540-2
- Wang X, Song L, Chong V, Wang Y, Li J, Xian J. Multiparametric MRI findings of sinonasal rhabdomyosarcoma in adults with comparison to carcinoma. J Magn Reson Imaging. 2017;45(4):998–1004. Available from: https://doi.org/10.1002/jmri.25484
- Böker SM, Adams LC, Bender YY, Fahlenkamp UL, Wagner M, Hamm B, et al. Differentiation of predominantly osteoblastic and osteolytic spine metastases by using susceptibility-weighted MRI. Radiology. 2019;290(1):146–154. Available from: https://doi.org/10.1148/radiol.2018172727
- Amini B, Duran-Sierra E, Madewell J, Murphy W, Costelloe C, Valenzuela RF. Advanced MRI can be used to determine percent necrosis in leiomyosarcoma. Eur Congr Radiol. 2024. Available from: https://dx.doi.org/10.26044/ecr2024/C-21238
- Valenzuela RF, Duran-Sierra EJ, Canjirathinkal MA, Amini B, Hwang KP, Ma J, et al. Early results in the novel use of contrast-enhanced susceptibility-weighted imaging in the assessment of response and progression in desmoid fibromatosis: a pilot study in a specialized cancer institution. Tumor Discov. 2023;2(3):1414. Available from: https://accscience.com/journal/TD/2/3/10.36922/td.1414
- Duran-Sierra E, Valenzuela RF, Canjirathinkal M, Madewell J, Murphy W, Costelloe C, Amini B. Susceptibility imaging (SWI) morphologic patterns and high-order radiomics of baseline and post-treatment advanced MRI of extremity soft-tissue undifferentiated pleomorphic sarcoma. Eur Congr Radiol. 2023. Available from: https://dx.doi.org/10.26044/ecr2023/C-19060
- Ghadimi M, Sapra A. Magnetic resonance imaging contraindications. In: StatPearls. Treasure Island (FL): StatPearls Publishing; 2025. PMID: 31869133. Available from: https://pubmed.ncbi.nlm.nih.gov/31869133/
- Melazzini L, Bortolotto C, Brizzi L, Achilli M, Basla N, D’Onorio De Meo A, Gerbasi A, Bottinelli OM, Bellazzi R, Preda L. AI for image quality and patient safety in CT and MRI. Eur Radiol Exp. 2025;9(1):28. Available from: https://doi.org/10.1186/s41747-025-00562-5