
More Information
Submitted: November 06, 2025 | Approved: November 14, 2025 | Published: November 17, 2025
How to cite this article: Amini B, Valenzuela RF, Duran-Sierra E, Antony M, Costelloe CM, Haddad EFN, et al. Pilot Study on Leiomyosarcoma of the Soft Tissues: Advanced Imaging Features to Predict Response to Neo-adjuvant Therapy. J Radiol Oncol. 2025; 9(3): 075-084. Available from:
https://dx.doi.org/10.29328/journal.jro.1001084
DOI: 10.29328/journal.jro.1001084
Copyright license: © 2025 Amini B, et al.. This is an open access article distributed under the Creative Commons Attribution License, which permits unrestricted use, distribution, and reproduction in any medium, provided the original work is properly cited.
Keywords: Soft Tissue Sarcoma (STS); Leiomyosarcoma (LMS); Multiparametric MRI; Pathologically Assessed Treatment Effect (PATE); Susceptibility-Weighted Imaging (SWI); Contrast-Enhanced Susceptibility-Weighted Imaging (CE-SWI); Radiomics
Abbreviations: ABASTI: Advanced Bone and Soft Tissue Tumor Imaging; ADC: Apparent Diffusion Coefficient; AUC: Area Under the Curve; CE-SWI: Contrast-Enhanced Susceptibility Weighted Imaging; PWI: Perfusion-Weighted Imaging; DWI: Diffusion-Weighted Imaging; GLCM: Grey-Level Co-Occurrence Matrix; GLRLM: Grey-Level Run Length Matrix; LMS: Leiomyosarcoma; MRI: Magnetic Resonance Imaging; NAT: Neoadjuvant Therapy; NR: Non-Responders; PATE: Pathology-Assessed Treatment Effect; PR: Partial Responders; R: Responders; RECIST: Response Evaluation Criteria in Solid Tumors; TIC: Time Intensity Curve; WHO: World Health Organization

Pilot Study on Leiomyosarcoma of the Soft Tissues: Advanced Imaging Features to Predict Response to Neo-adjuvant Therapy
Behrang Amini1, Raul F Valenzuela1* , Elvis Duran-Sierra1, Mathew Antony1, Colleen M Costelloe1, Elise F Nassif Haddad2, Sam LH Lo1, Pia V Valenzuela3, John E Madewell1, Jossue V Espinoza1 and William A Murphy Jr.11
1Department of Musculoskeletal Imaging, The University of Texas, MD Anderson Cancer Center, Houston, TX, USA
2Department of Sarcoma Medical Oncology, The University of Texas, MD Anderson Cancer Center, Houston, TX, USA
3Department of Psychology, Texas A&M University, USA
*Address for Correspondence: Raul F Valenzuela, Department of Musculoskeletal Imaging, The University of Texas, MD Anderson Cancer Center, Houston, TX, USA, Email: [email protected]
Advanced MR imaging features of soft-tissue leiomyosarcoma (LMS) have not been reported, and no imaging biomarkers exist for response to neoadjuvant therapy (NAT). The exploratory study pilot aims to address these deficiencies and gather initial evidence supporting its utility. Nine patients with LMS and advanced MRI at the pre-operative time point comprised the study population. Patients were dichotomized into responders (those with a treatment effect of ≥90%) and partial/non-responders (those with a treatment effect of < 90%) based on the pathology report. Custom software was used to measure lesions, derive volumetric radiomic features on contrast-enhanced susceptibility-weighted images (CE-SWI) and apparent diffusion coefficient (ADC) images, generate time-intensity curves (TICs), and estimate semi-quantitative perfusion variables. Imaging patterns were classified visually by the radiologists in consensus as aggressive vs. non-aggressive on CE-SWI, arterial phase perfusion images (PWI), and TICs. Fisher’s exact test was used to assess the association between these patterns and the response. At baseline, mean ADCmean was 1.28 × 10⁻³ mm2/s (95% CI: 0.843 - 1.72 × 10⁻³ mm2/s), and imaging patterns were all aggressive. No baseline features were predictive of response. At the preoperative time point, the non-aggressive CE-SWI pattern of “complete ring” was able to predict a response to NAT (odds ratio: 0.0, p = 0.018). CE-SWI radiomic analysis identified several predictive features. Receiver operating characteristic analysis of classification models based on CE-SWI and radiomic features on CE-SWI and ADC showed an AUC of 1. Our pilot study provides initial evidence on the use of advanced MRI features for characterizing treatment-naïve soft tissue LMS. Additionally, it supports the utility of advanced MRI features in determining treatment response on pre-operative/post-NAT scans, potentially outperforming all traditional size-based metrics.
Leiomyosarcoma (LMS) is a mesenchymal neoplasm with smooth muscle differentiation [1]. LMS most commonly occurs in the retroperitoneum and other intrabdominal locations, with a characteristic subgroup originating in large veins, particularly the inferior vena cava [1]. LMS can also arise in soft tissues, including skin, major vessels, and deep soft tissues [1,2]. Bone origin is rare [1,2]. While women constitute most patients with intra-abdominal LMS, the sex distribution is equal in the soft tissues [1]. Extremity LMS typically arises in the deep and superficial soft tissues, frequently metastasizes to the lungs, and has a poor prognosis. Superficial LMS tends to have a better prognosis than bone or deep soft-tissue LMS [3].
On conventional magnetic resonance imaging (MRI), lesions are typically well-circumscribed, isointense to hypointense on T1-weighted imaging (T1-WI), and hyperintense on T2-weighted imaging (T2-WI), demonstrating homogeneous enhancement [4,5]. Areas of focal fibrosis and myxoid change may be apparent. Necrosis can be present, particularly in larger tumors [6]. LMS of the extremities can have low signal areas compared with fat on fast spin-echo T2 sequences, which can be attributed to their leiomyosarcomatous histology. LMS of bone tend to be elongated juxta-articular metaphyseal tumors with a propensity toward cortical destruction. Deep soft-tissue LMS of the extremities tend to be large, well-circumscribed, heterogeneously enhancing tumors, often with hemorrhage and necrosis. Superficial soft-tissue LMS of the extremities are well-circumscribed, small, homogeneously enhancing masses, usually associated with fascial edema [3]. Advanced imaging features of soft tissue LMS, however, have not been described.
Patients with localized disease are typically treated with curative intent with en bloc resection that is often preceded by neoadjuvant systemic and radiation therapy. Determination of response to neoadjuvant therapy (NAT) requires histological analysis of the surgically resected tumor for necrosis, fibrosis, and other features. This pathologically assessed treatment effect (PATE) has been associated with survival in several soft tissue sarcoma subtypes, including LMS [7-10]. However, imaging assessment of response to NAT is limited due to its reliance on size-based criteria, such as response evaluation criteria in solid tumors (RECIST) and World Health Organization (WHO) [11]. Advanced bone and soft tissue tumor imaging (ABASTI) techniques, using MRI sequences such as diffusion-weighted imaging (DWI), perfusion imaging (PWI), and contrast-enhanced susceptibility-weighted imaging (CE-SWI) [12], and their radiomic assessment have been shown to predict response to NAT in undifferentiated pleomorphic sarcomas (UPS) [13,14]; however, it is unknown if the same results apply to LMS.
The aims of this exploratory pilot study are twofold. First, we will define advanced imaging features of soft tissue LMS at baseline, which have not been previously reported. Second, we will determine whether ABASTI and its first- and higher-order radiomic analysis can predict the response of LMS to NAT. Our central hypothesis regarding the second aim is that, similar to UPS, predictors of good response will be “complete blooming” or “complete ring” patterns on CE-SWI (Figure 1A,B), a non-aggressive (“capsular”) perfusion pattern on arterial phase perfusion images (Figure 2), and non-aggressive time-intensity curves (TICs) on PWI (Figure 3, types I and II).
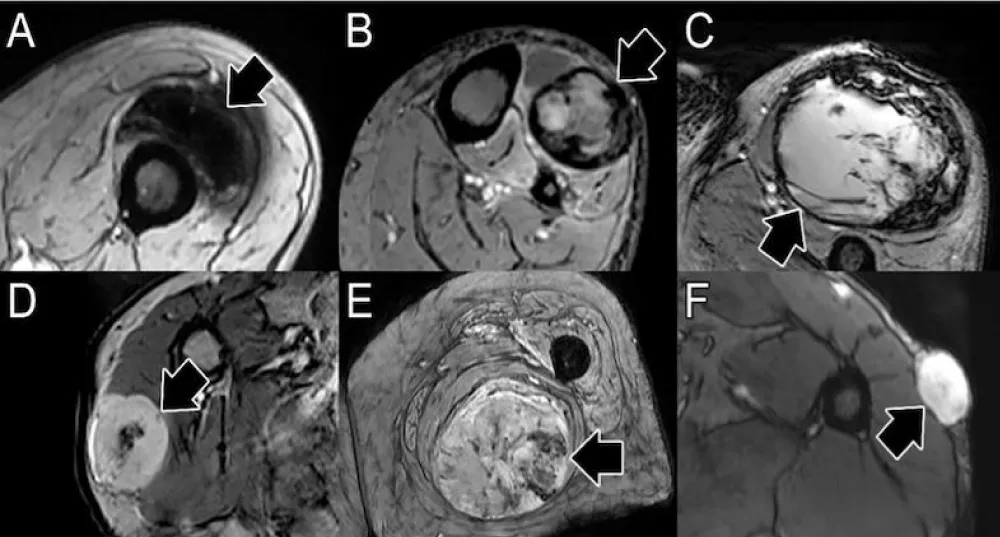
Figure 1: Patterns of response on contrast-enhanced susceptibility-weighted imaging (CE-SWI). Patterns of good response include full blooming (A, blooming artifact throughout the lesion) and complete ring (B, a complete black line of peripheral hemosiderin deposition surrounding the tumor). Patterns of incomplete and non-response include incomplete ring (C, partial blooming artifact around the lesion), globular (D, foci of blooming artifact in the center of the lesion), interstitial (E, non-focal areas of blooming in the lesion), and no blooming (F, solid enhancement with no blooming artifact in the lesion).
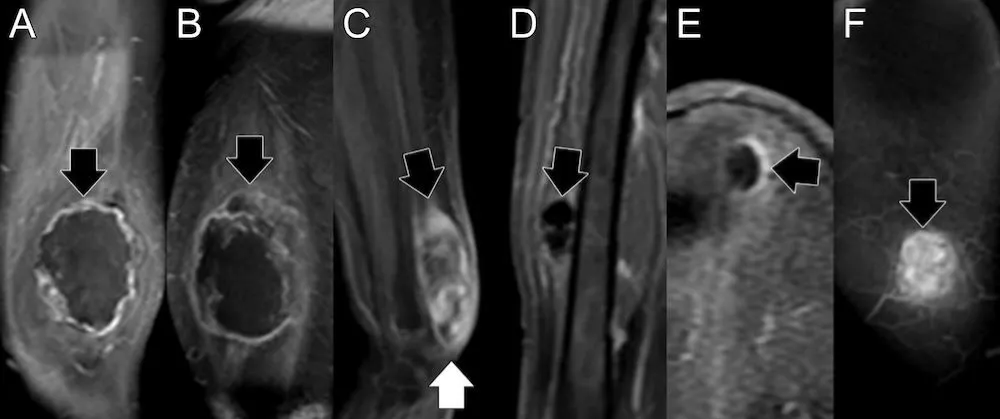
Figure 2: Patterns of perfusion on early arterial phase images. A) Capsular pattern, with linear or nodular enhancement limited to the capsule, and sparing the proximal and distal poles. B) Unipolar pattern, with peripheral enhancement and area(s) favoring either the proximal (arrow) or distal poles, but not both. C) Bipolar pattern, like unipolar, but with enhancing areas involving both the proximal (black arrow) and distal (white arrow) poles of the lesion. D) Non-nodular pattern, no enhancement, E) Semilunar pattern, partial capsular enhancement, F) Solid pattern, diffuse enhancement involving the entire lesion.
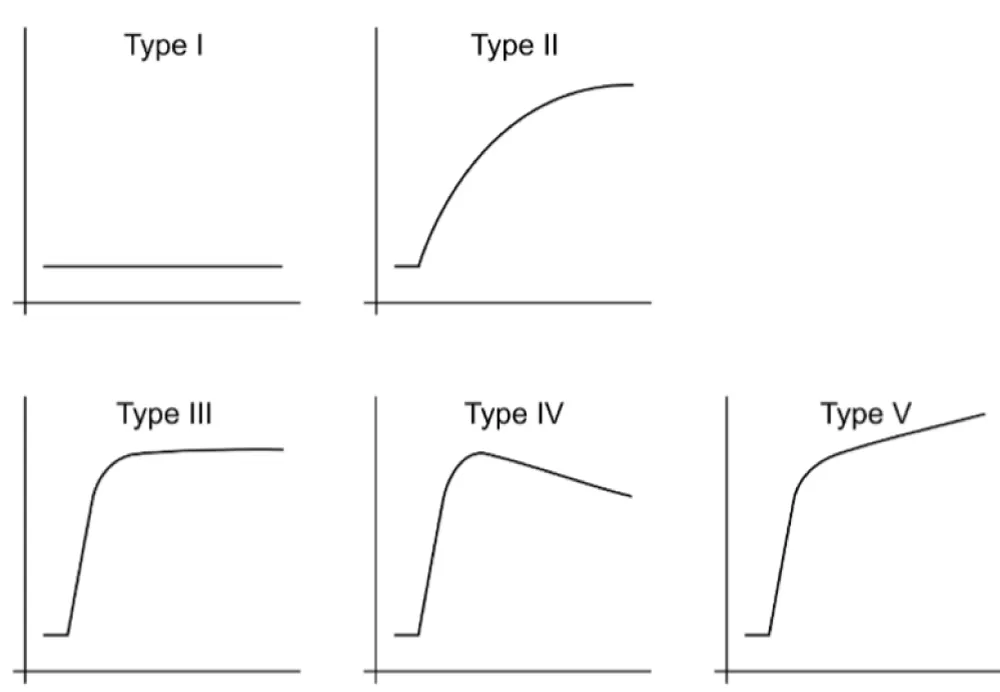
Figure 3: Time-intensity curves (TICs) from perfusion imaging. Non-aggressive TICs have minimal to no enhancement (type I) or slow wash-in (type II). Potentially aggressive TICs have a rapid wash-in followed by a plateau (type III), wash-out (type IV), and delayed enhancement (type V).
Study population
The UT MD Anderson Cancer Center Institutional Review Board (IRB) approved the study (IRB identifier PA16-0857; Protocol Name: “Utility of imaging of bone and soft tissue tumors and disease and treatment-related changes for diagnosis, prognosis, treatment response, and outcome”). Due to the study’s retrospective nature, the UT MD Anderson Cancer Center IRB waived the need to obtain informed consent for this study. All included data collection, management, and processing methods were performed in accordance with institutional and generally accepted relevant clinical and research guidelines and regulations. A search was conducted of radiology reports of soft tissue MRIs following the institution of ABASTI imaging (January 2021) to July 2024. A total of 125 reports of patients with LMS were retrieved. Of these, nine patients had preoperative ABASTI MRI and underwent surgical resection. The reference standard was the pathology report. Pathologically assessed treatment effect was classified as ≥90% (response), 31% - 89% (partial response), and ≤30% (non-response).
Visual inspection
Two fellowship-trained musculoskeletal radiologists reviewed the magnetic resonance images. CE-SW images were classified into one of six patterns (Figure 1) and dichotomized as non-aggressive (full blooming and complete ring) versus aggressive. Arterial phase images from perfusion images were visually classified into one of six patterns (Figure 2) and dichotomized into non-aggressive (capsular) and potentially aggressive (others). Time-intensity curves (TICs) were generated over the volume of the lesion, as described below, and classified into one of five types (Figure 3), with the curves dichotomized into non-aggressive (types I and II) and potentially aggressive (types III-V).
Image analysis
Lesion contouring was performed as previously described [14]. In brief, lesions were contoured in 3D on MIM (version 7.1.4, MIM Software Inc, Cleveland, OH) by a trained research assistant and confirmed by a fellowship-trained musculoskeletal radiologist. Custom in-house software was used to determine radiomic features of the lesion volumes on CE-SWI and ADC images, generate TICs, and estimate semi-quantitative perfusion variables.
Statistical analysis
Fisher’s exact test was performed to assess the association of CE-SWI patterns, TIC curves, and perfusion patterns with PATE (dichotomized as good response vs. partial and non-response). The radiomic features and semi-quantitative perfusion variables were compared in responders vs. partial/non-responders using two-tailed non-parametric Wilcoxon rank-sum tests. Receiver operating characteristic (ROC) analysis was performed to identify the most relevant imaging features that discriminate responders from partial or non-responders. All statistical analyses were implemented in Python 3.10.13 using the SciPy library version 1.12.0 and the Scikit-Learn library version 1.4.1. Statistical significance was assessed at 5% (p < 0.05).
The study population is shown in Table 1. The majority (67%) of patients were female. The average age was 62 years, with a range of 41 to 80. Of the 9 patients, 3 demonstrated a good response (≥90% PATE) to NAT, four patients showed a partial response (31% - 89% PATE), and 1 patient was classified as a non-responder (< 30% PATE) to NAT. A single patient (#8) did not undergo NAT.
| Table 1: Patient Population. | |||||||||||||||
| NAT | Baseline | Immediate pre-operative/post-NAT | |||||||||||||
| # | Sex | Age | Location | Gr. | XRT (Gy/fx) |
Tx | ADCmean ± SD (´10-3 mm2/s) |
CE-SWI pattern | TIC | Perfusion pattern | ADCmean ± SD (´10-3 mm2/s) |
CE-SWI pattern | TIC | Perfusion pattern | PATE |
| 1 | F | 56 | Lower leg | H | 40/15 | 1 | - | - | - | - | - | Complete ring | II | Capsular | 99% |
| 2 | M | 50 | Lower leg | I/H | 28.5/15 | - | - | - | - | - | 2.242 ± 0.703 | Complete ring | II | Bipolar | 95% |
| 3 | F | 69 | Lower leg | H | 40/15 | 2 | 1.501 ± 0.538 | Globular | V | Bipolar | 1.660 ± 0.481 | Complete ring | V | Unipolar | 90% |
| 4 | M | 63 | Thigh | - | 42.75/15 | - | 1.305 ± 0.227 | Interstitial | V | Bipolar | 1.420 ± 0.220 | Interstitial | II | Interstitial | 50% |
| 5 | F | 49 | Upper arm | H | - | 2 | - | - | - | - | 2.238 ± 0.492 | Interstitial | V | Solid | 50% |
| 6 | M | 74 | Thigh | H | 42.75/15 | 2 | - | - | - | - | 1.849 ± 0.323 | Interstitial | II | Bipolar | 40% |
| 7 | F | 75 | Thigh | H | OSI | - | - | - | - | - | 1.130 ± 0.264 | No blooming | III | Capsular | 10% |
| 8* | F | 41 | Thigh | L | - | - | 0.887 ± 0.225 | No blooming | III | Solid | - | No blooming | III | Solid | 0% |
| 9 | F | 80 | Thigh | H | 50/25 | - | 1.434 ± 0.414 | Interstitial | V | Bipolar | 1.894 ± 0.464 | Interstitial | V | Unipolar | 45% |
On Figure 4 – Conventional size-based metrics in responders and partial/non-responders comparing changes in diameter, area (WHO), and volume at baseline and the pre-/post-NAT time course. Partial response and progression thresholds for RECIST, WHO, and volume are indicated by the green and red horizontal lines, respectively: PD, progressive disease; PR, partial response.
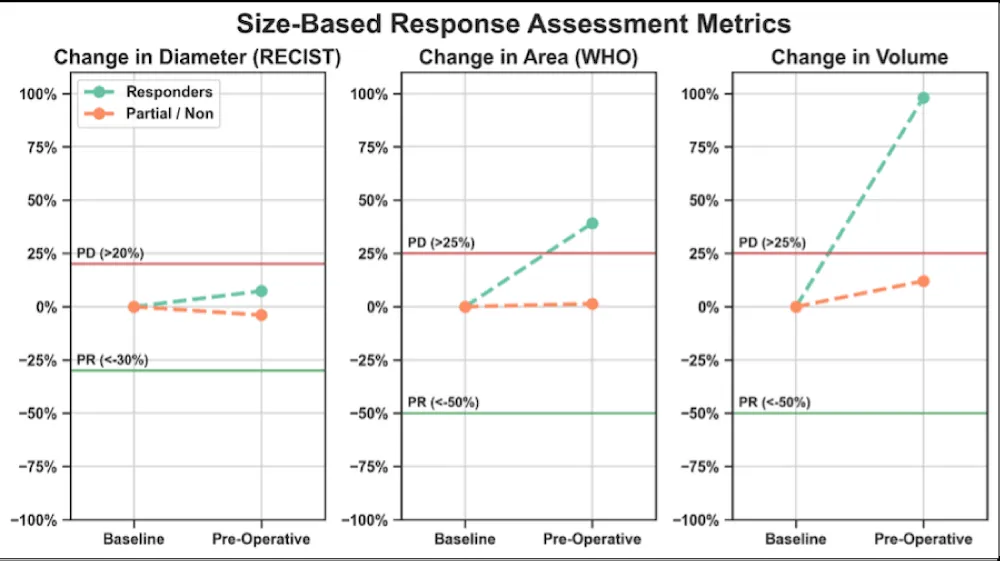
Figure 4: Presents the results from the RECIST, WHO, and volumetric analysis in responders and partial/non-responders across treatment. At the pre-operative/post-NAT timepoint, responders had tumor size changes with respect to baseline that fell within the range of stability on RECIST (between -30% and +20%), and displayed WHO and volumetric progression, crossing the threshold of +25%. Partial/non-responders demonstrated RECIST, WHO, and volumetric stability at the preoperative/post-NAT time point compared to baseline.
Advanced imaging features at baseline
Of the 9 patients, 4 had advanced imaging at baseline (Table 1). The mean ADC of the lesions was 1.28 × 10⁻³ mm2/s (95% CI: 0.843 - 1.72 × 10⁻³ mm2/s) and ranged from 0.887 - 1.501 × 10⁻³ mm2/s. Two lesions (50%) had an interstitial CE-SWI pattern, one (25%) had a globular pattern, and one (25%) had a non-blooming pattern. The perfusion morphologic pattern on early arterial images was bipolar in 3 cases (75%) and solid in one (25%). The TICs were all aggressive, with 3 (75%) demonstrating a type V curve and one (25%) demonstrating a type III curve.
Association of advanced MRI patterns and response to NAT
Of the 4 patients with advanced imaging at baseline, there was 1 responder, 2 partial responders, and 1 non-responder. The CE-SWI pattern at baseline (Figure 5A) of the 1 responder was globular. The 2 partial responders had an interstitial pattern, and the 1 non-responder demonstrated the no-blooming pattern. The PWI pattern at baseline (Figure 5B) of the 1 responder and the 2 partial responders was bipolar. The non-responder demonstrated solid enhancement. The TIC at baseline (Figure 5C) was type V for the 1 responder and the 2 partial responders. The non-responder had a type III pattern.
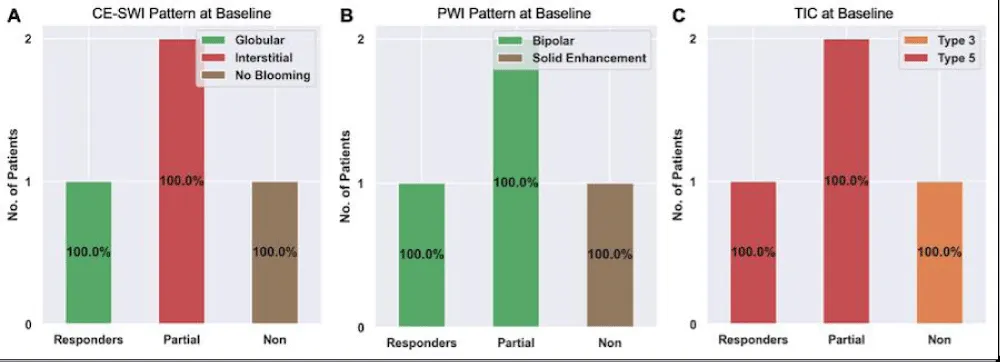
Figure 5: Advanced MRI features at baseline among responders, partial responders, and non-responders. Please refer to Figures 1-3 for examples of these patterns.
Of He 9 patients, 8 underwent NAT, and all 8 had advanced imaging on the pre-operative/post-NAT MRI. Among this group, there were 3 responders, 4 partial responders, and 1 non-responder.
The CE-SWI pattern on the pre-operative/post-NAT MRI (Figure 6A) of all 3 responders was a complete ring. The three partial responders exhibited an interstitial pattern, and the one non-responder demonstrated the no-blooming pattern.
The PWI morphologic pattern (Figure 6B) of the 3 responders was capsular, unipolar, and bipolar (1 each). The 4 partial responders had unipolar (n = 1), bipolar (n = 1), and solid enhancement (n = 2) at the pre-operative/post-NAT scan. The 1 non-responder demonstrated a capsular pattern.
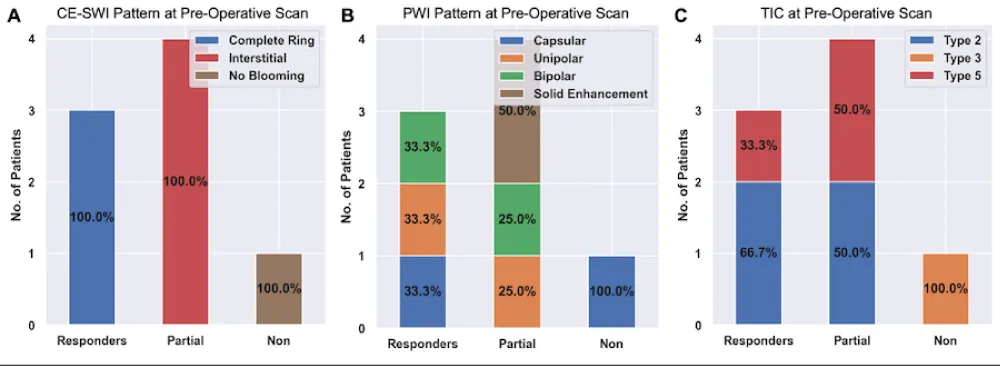
Figure 6: Advanced MRI features on the pre-operative/post-NAT scans among responders, partial responders, and non-responders. Please refer to Figures 1-3 for examples of these patterns.
The TIC on the pre-operative/post-NAT scan (Figure 6C) was type II (n = 2) and V (n = 1) for the responders. The partial responders also demonstrated type II (n = 2) and type V (n = 2) TICs. The non-responder had a type III pattern.
We next assessed the association of non-aggressive patterns on the pre-operative/post-NAT MRI with treatment response. The non-aggressive patterns on CE-SWI (full bloom and complete ring patterns, Figure 1A,B) were associated with a good response (odds ratio: 0, p = 0.018). The non-aggressive PWI patterns and TIC, however, were not associated with a good response (odds ratio: 0.5, p = 1.0 and odds ratio: 0.33, p = 1.0, respectively). Semi-quantitative perfusion variables from the TICs at pre-operative/post-NAT MRI were not associated with treatment response (Figure 7).
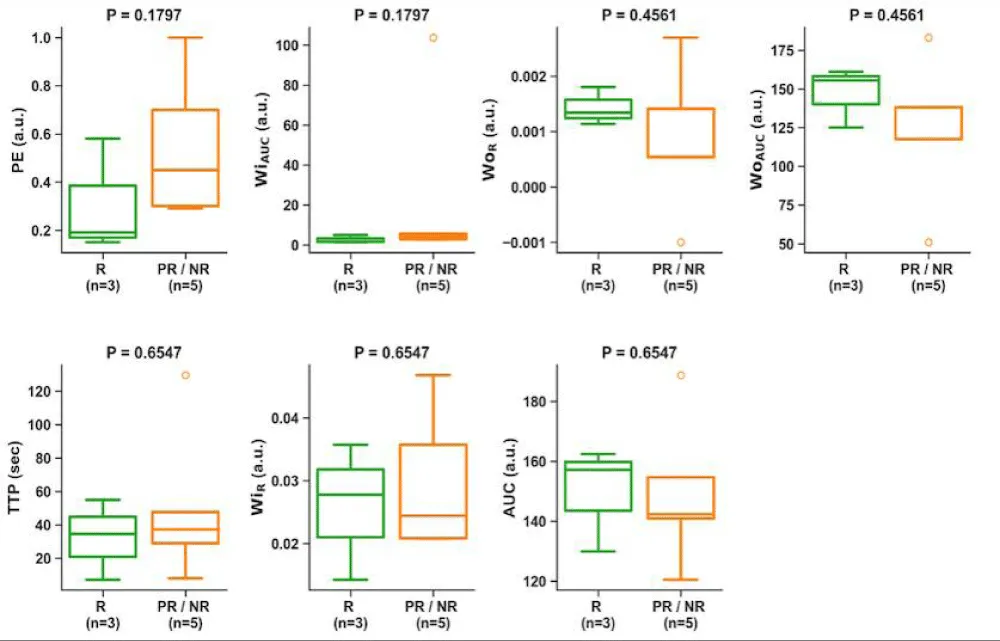
Figure 7: Association of semi-quantitative perfusion variables on the pre-operative/post-NAT MRI with response. There was no significant difference in these variables and the response. PE, peak enhancement; WiAUC, wash-in area under the curve; WOR, wash-out rate; WOAUC, wash-out area under the curve; TTP, time to peak; WIR, wash-in rate; AUC, area under the TIC.
Changes in MRI patterns between baseline and pre-operative/post-NAT scans
We next assessed changes in first-order radiomic features of CE-SWI and ADC images between baseline and preoperative/post-NAT MRIs for responders and partial/non-responders (Tables 2,3, and Figure 8). There was no significant change between the baseline and pre-operative/post-NAT scans on CE-SWI (Table 2) or ADC (Table 3). When comparing the first-order features of responders to partial/non-responders (Figure 8), only the CE-SWI skewness displayed a significant difference (p = 0.0253; Figure 9) between them at the pre-operative/post-NAT time point.
| : Change in CE-SWI First-Order Radiomics from Baseline to Pre-Operative/Post-NAT. | |||||
| Change in mean | Change in skewness | Change in kurtosis | Change in the 10th percentile | Change in the 90th percentile | |
| Responders | -53% (p = 0.65) |
-35% (p = 0.65) |
-82% (p = 1.0) |
+882% (p = 1.0) |
-100% (p = 1.0) |
| Partial/non-responders | -51% (p = 0.65) |
-76% (p = 0.1) |
-26% (p = 0.88) |
+407% (p = 1.0) |
-366% (p = 1.0) |
| Table 3: Change in ADC First-Order Radiomics from Baseline to Pre-Operative/Post-NAT. | |||||
| Change in mean | Change in skewness | Change in kurtosis | Change in the 10th percentile | Change in the 90th percentile | |
| Responders | +30% (p = 0.22) |
-257% (p = 0.22) |
-251% (p = 0.22) |
+55% (p = 1.0) |
+14% (p = 1.0) |
| Partial/non-responders | +41% (p = 0.18) |
-54% (p = 0.18) |
-73% (p = 0.18) |
-76% (p = 0.33) |
+188% (p = 0.33) |
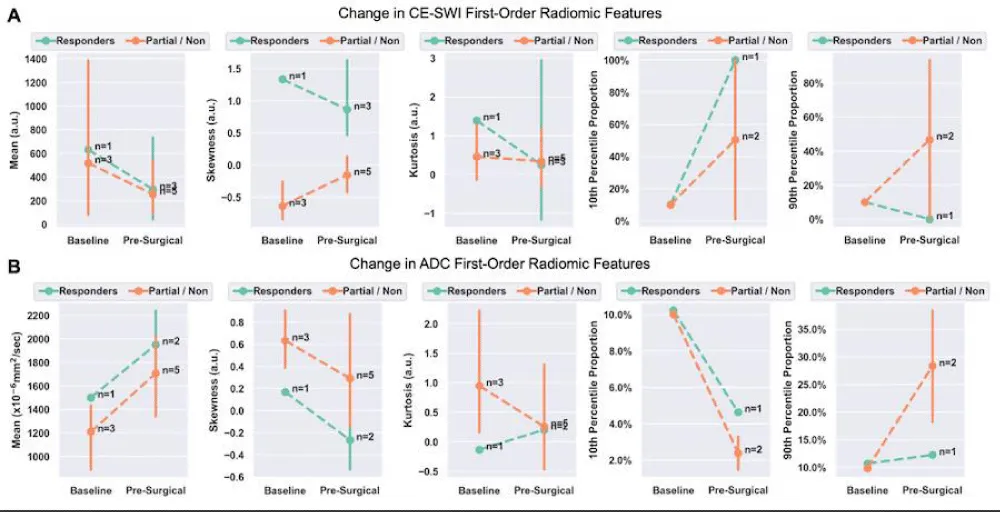
Figure 8: Change in first-order radiomic features on CE-SWI (A) and ADC (B) between baseline and pre-operative/post-NAT MRIs. A statistically significant difference was observed in CE-SWI skewness in responders vs. partial/non-responders at the pre-operative/post-NAT time point.
Association of radiomic MRI features on pre-operative/post-NAT MRI with response to NAT
We next assessed the association of radiomic features on the pre-operative/post-NAT MRI as a predictor of response. Patients were dichotomized as responders and partial/non-responders. The CE-SWI features that were significantly different between the two groups (Figure 9) included the first-order variable, skewness, as well as the higher-order gray-level co-occurrence matrix (GLCM) features, cluster shade (with the highest separation), joint average, and sum average. The ADC first-order feature range provided the highest separation between responders and partial/non-responders (p = 0.0528; Figure 10); however, neither this feature nor any of the other features were statistically or significantly associated with treatment response.
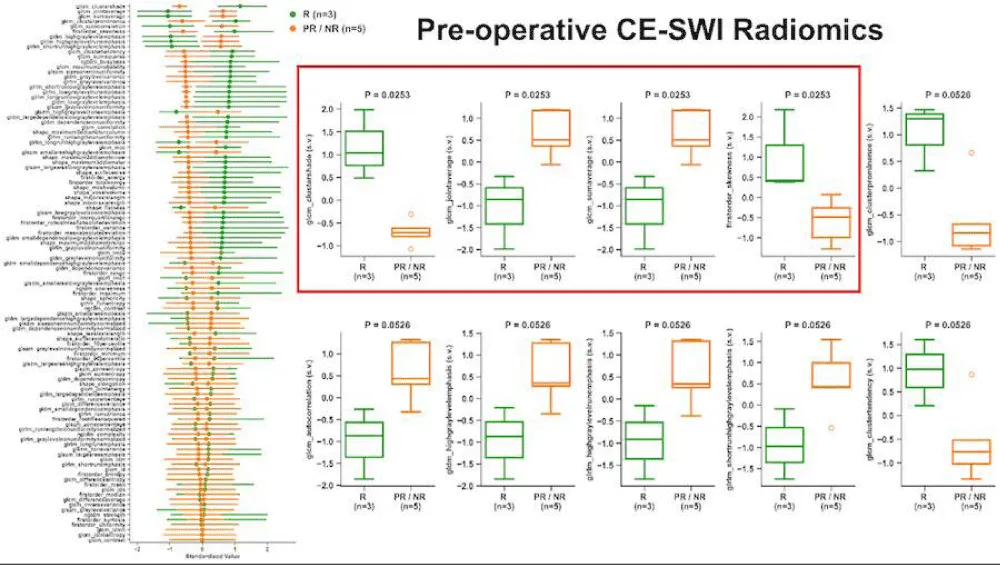
Figure 9: Association of radiomic features on CE-SWI with treatment response. The left column depicts the ability of the variable of interest to differentiate between responders (R, green) and partial/non-responders (PR/NR, orange). Box plots demonstrate the difference between R and PR/NR for the top-performing variables.
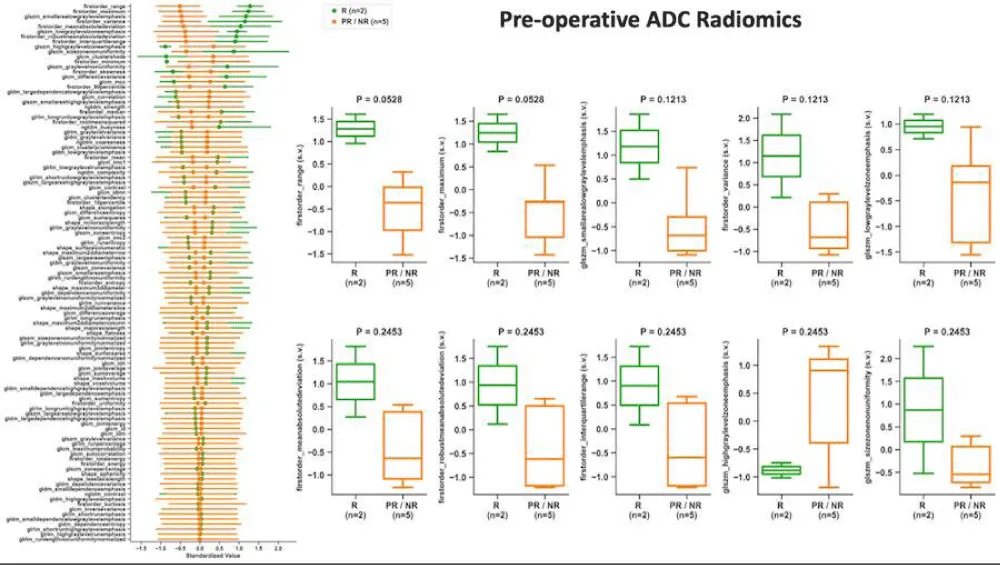
Figure 10: Association of radiomic features on ADC with treatment response. The left column depicts the ability of the variable of interest to differentiate between responders (R, green) and partial/non-responders (PR/NR, orange). Box plots demonstrate the difference between R and PR/NR for the top-performing variables.
We next developed models to assess the contribution of the different modalities to the classification of lesions as having responded to NAT (Figure 11). The three models, based on the top-performing CE-SWI and ADC radiomic features and non-aggressive CE-SWI (complete ring in this study), yielded perfect classification performance (AUC = 1.0) between responders and partial/non-responders, outperforming the model based solely on the non-aggressive TIC (type II curve in this study, AUC = 0.63).
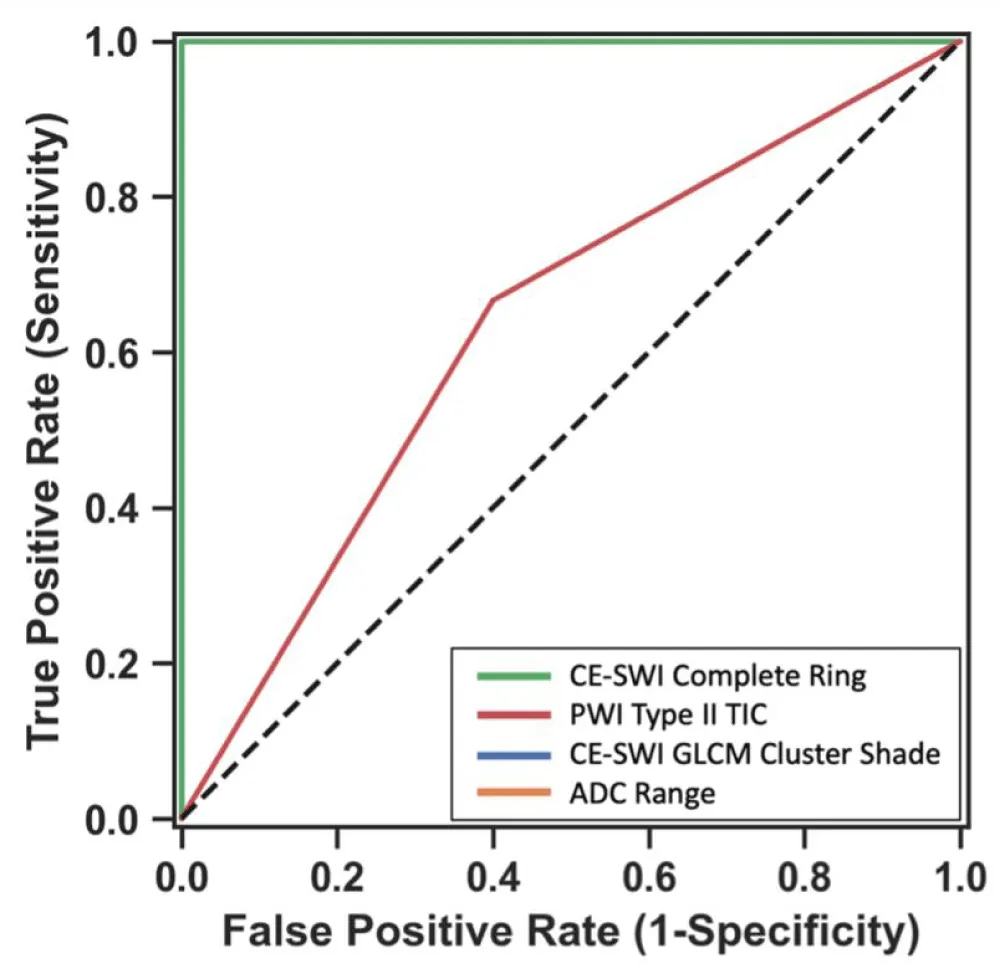
Figure 11: Receiver operating characteristics of 4 different models for classification of lesions as responders vs. partial/non-responders. Please note the lines for the models based on CE-SWI Complete Ring, CE-SWI GLCM Cluster Shade, and ADC Range overlap (AUC = 1.0). The PWI Type II TIC had an AUC of 0.63.
Leiomyosarcomas of the soft tissues are a distinct subgroup of leiomyosarcomas, accounting for 10-15% of sarcomas and most commonly arising from cutaneous, subcutaneous, and intramuscular soft tissues. Advanced MRI can aid in the classification and grading of soft tissue sarcomas, and certain features have been identified that are associated with a good response (greater than 90% pathologically assessed treatment effect) [15], as illustrated in Figures 1-3. However, the generalizability of these results to LMS of the soft tissues is unknown. Additionally, the advanced imaging features of soft tissue LMS at baseline have not been previously described.
Conventional size metrics, including RECIST and WHO, as well as volumetric analysis, were unable to predict response. RECIST showed stability in all responders, while WHO and volume showed stability in partial/non-responders and progression in responders. This progression in responders represents the phenomenon of pseudoprogression, characterized by the enlargement of a tumor that ultimately responds.
The ADC mean of lesions before therapy, measured over their entire volumes, was 1.28 x 10⁻³ mm2/s (95% CI: 0.843- 1.72 x 10⁻³ mm2/s), which overlaps with the range reported for uterine LMS (0.904 x 10⁻³ mm2/s, 95% CI: 0.832- 0.976 x 10⁻³ mm2/s) [16]. The pre-therapeutic lesions all exhibited aggressive CE-SWI patterns (Figure 5A and Table 1), with half demonstrating the interstitial CE-SWI pattern and the rest showing the globular and non-blooming patterns. The perfusion pattern on early arterial images was also aggressive, with bipolar perfusion in the majority of cases and solid perfusion in 25% (Figure 5B). The TICs were similarly aggressive (Figure 5C), with all lesions demonstrating rapid arterial wash-in (the majority were type V, and 25% type III). This is similar to the TIC reported for uterine LMS, where the majority demonstrated rapid arterial wash-in [17]. We did not detect advanced imaging features at baseline that could predict response to NAT. This is most likely related to the small sample size (n = 4 out of 9).
On the pre-operative/post-NAT scans, there was a change in the distribution of features from baseline (Figures 6,8 and Tables 2,3). However, none of these changes were significant, and there was no significant difference in the changes between responders and partial/non-responders. There was also no significant difference in semi-quantitative perfusion features and response to treatment (Figure 7).
We found a significant association between pre-operative/post-NAT imaging features on CE-SWI and treatment response. First, visual classification of the CE-SWI pattern provided excellent predictive capability in identifying responders. The complete ring pattern was significantly associated with a good response (odds ratio, 0; p = 0.018). This is clinically relevant, as this pattern can be identified on the workstation and requires no additional software for contouring or analysis. CE-SWI radiomic analysis identified several significantly different features between the responders and partial/non-responders (Figure 9). These included the skewness (a first-order feature) and the higher-order GLCM features cluster shade, joint average, and sum average. GLCM cluster shade provided the best separation between responders and partial/non-responders. On the pre-operative/post-NAT MRI, radiomic analysis of ADC did not reveal a significant difference between responders and partial/non-responders (Figure 10). The first-order variable range provided the most separation.
We next developed models based on the strongest features identified above: Complete ring pattern on CE-SWI, non-aggressive TIC, and the top-performing CE-SWI and ADC radiomic features (GLCM cluster shade and range, respectively). ROC analysis showed a perfect AUC of 1 for all but the non-aggressive TIC (AUC = 0.63). Of the advanced imaging features studied, we found CE-SWI to be the most useful in assessing response to NAT. CE-SWI can simultaneously detect T2* susceptibility related to hemorrhage, T2 signal related to necrosis, and enhancement related to viable tumor. CE-SWI detects post-therapeutic effects, such as hemosiderin deposition, granulation tissue formation, fibrosis, and calcification, which typically appear as areas of low to intermediate signal intensity. A viable enhancing tumor, on the other hand, appears as high signal intensity. We have shown that visual and radiomic analysis of the CE-SWI images can reliably assess therapeutic response.
According to the National Comprehensive Cancer Network (NCCN, version 1.2025) [18]. MRI with contrast is the preferred imaging modality for LMS, and generally, for patients with suspected soft tissue sarcoma of the extremities, trunk/surface area, or head and neck. Beyond MRI, a CT scan, which is less sensitive, can also be used. Additionally, CT angiograms and plain radiographs may be helpful in certain circumstances. For staging, the NCCN recommends a CT scan of the chest/abdomen/pelvis, or a combination of a chest CT scan with an MRI of the abdomen and pelvis. An FDG-PET/CT scan or a bone scan can also be used to evaluate bone. In the follow-up and surveillance stages, MRI is considered the most effective modality for monitoring local recurrence of the primary site in patients with high risk [18]. CT is less sensitive and can be used as an alternative when MRI is not available. Ultrasound (US) is helpful to identify early local recurrence in small and superficial nodules with a diameter of less than 0.5 cm. Chest CT without contrast (preferred) or plain radiographs (less sensitive) help detect asymptomatic distant recurrence.
Limitations
Our study has several limitations. First, this was a retrospective study, and the patient population was selected based on the availability of advanced MRI before surgery. This reflects the absence of truncal and head and neck soft tissue LMS, which, until recently, were not assessed with advanced MRI at our institution. Second, although the study represents the largest cohort of soft tissue LMS patients undergoing advanced imaging, the study population is small, which limits the study’s statistical power; nonetheless, this is expected given the exploratory nature of this pilot study.
Our pilot study provides initial evidence on the use of advanced MRI features for characterizing treatment-naïve soft tissue LMS for the first time. In addition, we have presented evidence supporting the utility of advanced MRI features through visual inspection and radiomic analysis, in determining treatment response on pre-operative/post-NAT scans, potentially outperforming all traditional size-based metrics, such as RECIST, WHO, and volume assessments. CE-SWI appears to be the sequence with the highest clinical utility, as simple visual inspection provides an excellent correlation with treatment response. The encouraging early results need to be followed by an expanded clinical sample to support the statistical findings initially suggested here. This study contributes to a growing body of evidence on the use of CE-SWI to assess the response of soft tissue sarcomas to NAT, adding to prior publications on UPS, RMS, Desmoid Fibromatoses, among others, given its intrinsic capability to simultaneously characterize bleeding patterns and enhance viable tumor.
The John S. Dunn, Sr. Distinguished Chair in Diagnostic Imaging and the M. R. Evelyn Hudson Foundation Endowed Professorship funded the study.
Author contributions statements
BA and RV conceived of and designed the study and selected patients for inclusion. MA contoured the lesions and was responsible for acquiring the data. EDS analyzed the data. BA created 1-3. EDS created figures 4-11. BA, RV, PVV, JVE, EDS, CMC, EFNH, SLHL, JEM, and WAM interpreted the data and contributed to revisions. All authors reviewed the manuscript.
Data availability statement
The datasets used and/or analyzed during the current study are available from the corresponding author ([email protected]) upon reasonable request.
- Dry SM, Frohling S. Leiomyosarcoma. In: WHO Classification of Tumours: Soft Tissue and Bone Tumours. The WHO Classification of Tumours Editorial Board, editor. Lyon (France): International Agency for Research on Cancer (IARC); 2020;195–197.
- Chuanping G, Weiwei F. Recurrent, giant subcutaneous leiomyosarcoma of the thigh. Radiol Case Rep. 2015;10(3):18–21. Available from: https://doi.org/10.1016/j.radcr.2015.06.005
- Gordon RW, Tirumani SH, Kurra V, Shinagare AB, Jagannathan JP, Hornick JL. MRI, MDCT features, and clinical outcome of extremity leiomyosarcomas: experience in 47 patients. Skeletal Radiol. 2014;43(5):615–622. Available from: https://doi.org/10.1007/s00256-014-1823-8
- Abd Kadir HK, Naik J, Chandrasekar CR. Leiomyosarcoma presenting as ‘idiopathic’ unilateral lower limb lymphoedema. BMJ Case Rep. 2017;2017. Available from: https://doi.org/10.1136/bcr-2017-219898
- Morel M, Taïeb S, Penel N, Mortier L, Vanseymortier L, Robin YM, et al. Imaging of the most frequent superficial soft-tissue sarcomas. Skeletal Radiol. 2011;40(3):271–284. Available from: https://doi.org/10.1007/s00256-009-0855-y
- Hoshi M, Oebisu N, Ieguchi M, Ban Y, Takami M, Nakamura H. Clinical features of soft tissue sarcoma presenting intra-tumour haematoma: case series and review of the literature. Int Orthop. 2017;41(1):203–209. Available from: https://doi.org/10.1007/s00264-016-3322-0
- Bonvalot S, Wunder J, Gronchi A, Broto JM, Turcotte R, Rastrelli M, Papai Z, et al. Complete pathological response to neoadjuvant treatment is associated with better survival outcomes in patients with soft tissue sarcoma: results of a retrospective multicenter study. Eur J Surg Oncol. 2021;47(8):2166–2172. Available from: https://doi.org/10.1016/j.ejso.2021.02.024
- Mullen JT, Hornicek FJ, Harmon DC, Raskin KA, Chen YL, Szymonifka J. Prognostic significance of treatment-induced pathologic necrosis in extremity and truncal soft tissue sarcoma after neoadjuvant chemoradiotherapy. Cancer. 2014;120(23):3676–3682. Available from: https://doi.org/10.1002/cncr.28945
- Donahue TR, Kattan MW, Nelson SD, Tap WD, Eilber FR, Eilber FC. Evaluation of neoadjuvant therapy and histopathologic response in primary, high-grade retroperitoneal sarcomas using the sarcoma nomogram. Cancer. 2010;116(16):3883–3891. Available from: https://doi.org/10.1002/cncr.25271
- Shah D, Borys D, Martinez SR, Li CS, Tamurian RM, Bold RJ, et al. Complete pathologic response to neoadjuvant radiotherapy is predictive of oncological outcome in patients with soft tissue sarcoma. Anticancer Res. 2012;32(9):3911–3915. Available from: https://pubmed.ncbi.nlm.nih.gov/22993336/
- Benjamin R. Measuring drug response in sarcoma. Clin Adv Hematol Oncol. 2006;4(7):513–514. Available from: https://pubmed.ncbi.nlm.nih.gov/17147238/
- Valenzuela RF, Madewell JE, Kundra V, Costelloe CM. Advanced imaging in musculoskeletal oncology: moving away from RECIST and embracing advanced bone and soft tissue tumor imaging (ABASTI) – Part I – tumor response criteria and established functional imaging techniques. Semin Ultrasound CT MR. 2021;42(2):201–214. Available from: https://doi.org/10.1053/j.sult.2020.08.012
- Valenzuela RF, Amini B, Duran-Sierra E, Canjirathinkal MA, Madewell JE, Costelloe CM, et al. Multiparametric MRI for the assessment of treatment effect and tumor recurrence in soft-tissue sarcoma of the extremities. J Radiol Oncol. 2023;7(3):058–065. Available from: https://doi.org/10.29328/journal.jro.1001055
- Sierra ED, Valenzuela R, Canjirathinkal MA, Costelloe CM, Moradi H, Madewell JE, et al. Cancer radiomic and perfusion imaging automated framework: validation on musculoskeletal tumors. JCO Clin Cancer Inform. 2024;8:e2300118. Available from: https://doi.org/10.1200/cci.23.00118
- Valenzuela RF, Duran-Sierra E, Canjirathinkal M, Costelloe C, Idrees H, Madewell J, et al. Multiparametric MRI for the treatment assessment of lower extremity soft-tissue undifferentiated pleomorphic sarcoma (UPS). In: ECR 2024. Vienna (Austria): European Society of Radiology; 2024. Available from: https://epos.myesr.org/poster/esr/ecr2024/C-11063
- Woo S, Beier SR, Tong A, Hindman NM, Vargas HA, Kang SK. Utility of ADC values for differentiating uterine sarcomas from leiomyomas: systematic review and meta-analysis. Am J Roentgenol. 2024. Available from: https://doi.org/10.2214/ajr.24.31280
- Thomassin-Naggara I, Dechoux S, Bonneau C, Morel A, Rouzier R, Carette MF, et al. How to differentiate benign from malignant myometrial tumours using MR imaging. Eur Radiol. 2013;23(8):2306–2314. Available from: https://doi.org/10.1007/s00330-013-2819-9
- National Comprehensive Cancer Network (NCCN). NCCN Clinical Practice Guidelines in Oncology (NCCN Guidelines): Soft Tissue Sarcoma. Version 1.2025. Available from: https://www.nccn.org