
More Information
Submitted: February 03, 2026 | Accepted: February 12, 2026 | Published: February 13, 2026
Citation: Valenzuela RF, Duran-Sierra E, Pin KH, Ma J, Canjirathinkal M, Espinoza-Figueroa J, et al. Beyond Radiologic Perception: A Pilot Quantitative and Radiomic Comparison between Zero-Echo-Time MRI and CT in Oncologic Metastatic Screening. J Radiol Oncol. 2026; 10(1): 009-015. Available from:
https://dx.doi.org/10.29328/journal.jro.1001086
DOI: 10.29328/journal.jro.1001086
Copyright license: © 2026 Valenzuela RF, et al.. This is an open access article distributed under the Creative Commons Attribution License, which permits unrestricted use, distribution, and reproduction in any medium, provided the original work is properly cited.
Keywords: Zero-Echo-Time MRI; oZTEo; CT; Radiomics; Bone

Beyond Radiologic Perception: A Pilot Quantitative and Radiomic Comparison between Zero-Echo-Time MRI and CT in Oncologic Metastatic Screening
Raul F Valenzuela1*, Elvis Duran-Sierra1, Ken-Hwan Pin2, Jingfei Ma2, M Canjirathinkal1, Jossue Espinoza-Figueroa1, Ali Askari1, Pia Valenzuela3, Sam Lo1, John E Madewell1, William A Murphy Jr1, Jason Stafford2, Nisha Yadav2, Chengyue Wu2, Behrang Amini1, Maggie Fung4 and Colleen M Costelloe1
1Department of Musculoskeletal Imaging, MD Anderson Cancer Center, Houston, Texas, USA
2Department of Medical Physics, MD Anderson Cancer Center, Houston, Texas, USA
3Department of Psychology, Texas A&M, College Station, Texas, USA
4GE HealthCare, New York, USA
*Corresponding author: Raul F Valenzuela, Department of Musculoskeletal Imaging, MD Anderson Cancer Center, Houston, Texas, USA, Email: [email protected]
Introduction: Zero-Echo-Time (ZTE) and Ultrashort-Echo-Time (UTE) are MRI pulse sequences designed to image tissues with very short transverse relaxation times on short-T2 materials, which lose signal rapidly after excitation and are typically not visible on standard MRI scans. These sequences can increase bone contrast, producing images that resemble computed tomography (CT) by using ray-sum rendering, which sums signal intensities along a line to mimic X-ray imaging, and inverse-logarithm rescaling, which adjusts signal values using the inverse of the logarithm to enhance contrast. Previous ZTE publications often employ perception analysis, evaluating images based on expert observer ratings, to validate the method as a CT-surrogate. We aim to quantitatively compare oZTEo, a GE Healthcare (GEHC)-developed implementation of ZTE MRI, with CT using radiomic analysis on normal bone.
Methods: Beginning in July 2025, ZTE/oZTEo was incorporated into routine musculoskeletal pelvic MRI protocols at our institution using 9 GEHC MRI scanners (2 at 3 Tesla, 7 at 1.5 Tesla). This prospective study includes 26 patients who underwent CT and MRI screening for bone metastases, with a time interval of less than 6 months between the modalities. MR and CT images were retrieved from the institutional database. Manual 3D volume-of-interest (VOI) segmentations were performed on healthy right hips, or on the left if the right was affected by pathology or hardware. Custom Python-based software extracted 107 quantitative radiomic features per VOI. Features were standardized using Z-score normalization. In cases where ZTE was acquired, gray-scale inversion was applied, with bright regions becoming dark and vice versa, to match CT style. In contrast, for commercial oZTEo acquisition, gray-scale inversion was already automatically applied during product reconstruction; therefore, further gray-scale inversion was not needed. Statistical comparisons were performed for all 107 features between oZTEo (n = 26) and CT (n = 26). Manual measurements of multifocal cortical and marrow intensity were also obtained from all patients. Resulting intensity histograms from both modalities were standardized, aligned, and averaged across patients.
Results: Of the 26 patients, 11 (42%) were male and 15 (58%) were female, with a mean age of 50 years (range: 24–76). Twenty-two right and four left hip VOIs were segmented on both oZTEo and CT scans. The mean interval between MRI and CT was 2 months (range: 1 day to 6 months). Following gray-scale inversion of ZTE radiomics, all features were statistically similar to CT (p > 0.00047). Without this correction, ZTE features appeared as inverted images of the CT feature distribution. Mean cortex and marrow intensities from oZTEo were 1,653 ± 729 a.u. and 1,257 ± 691 a.u., compared to 1,148 ± 288 H.U. and 115 ± 110 H.U. for CT. Before standardization, the percentage differences between oZTEo and CT for the average histogram mean, skewness, kurtosis, 10th percentile, and 90th percentile were 324%, -54%, -100%, 1,528%, and 231%, respectively. Histogram area overlap was limited to 27%, with 42% and 3% overlap for cortex and marrow ranges. After standardization and histogram alignment, differences were markedly reduced: mean (0%), skewness (-10%), kurtosis (-20%), 10th percentile (3%), and 90th percentile (6%). Histogram area overlap increased to 95%, with cortex and marrow overlaps rising to 84% and 72%.
Conclusion: This pilot study provides initial quantitative and radiomic evidence that oZTEo and CT exhibit substantial objective similarity beyond perceptual visual assessment, supporting oZTEo as a clinically viable MRI alternative to conventional CT for bone evaluation. These promising pilot findings will be subsequently validated in a larger cohort, including cases with sclerotic and lytic bone lesions.
The mineralized structures of normal bone have a low water content of approximately 20%, resulting in a very low proton density that is insufficient to generate an appreciable signal on conventional magnetic resonance imaging (MRI) sequences [1,2]. Exacerbating this problem, the unbound water molecules in the small Haversian canals and lacunae of bone are exposed to weak intermolecular interactions, resulting in extremely short T2 relaxation times of 250-500 µsec [3]. Conventional MRI sequences use echo times >1 msec, which prevents them from sampling this information [3], which is why the normal cortex is typically depicted as a black signal void [1,4].
Zero-Echo-Time (ZTE) and Ultrashort-Echo-Time (UTE) MRI are advanced techniques developed to capture signals from tissues with extremely short T2 and T2* relaxation times, such as cortical bone, mineralized bone, calcifications, ligaments, and tendons, which typically yield no signal on conventional MRI [5-7]. They use ultrafast readouts to acquire the free-induction-decay signal almost immediately after radiofrequency (RF) excitation [8]. ZTE achieves an effective or nominal echo time of near-zero duration by applying the readout gradient before a very short RF pulse, thereby enabling instantaneous encoding of the newly created transverse magnetization [9]. A key benefit of ZTE is that it generates very low acoustic noise because the readout gradients are applied continuously, avoiding the rapid on-and-off switching typical of other sequences [5]. The resulting images are proton density-weighted images that require post-processing, such as inverse-logarithmic rescaling or gray-scale inversion, to produce a “CT-like” contrast in which bone appears bright, offering a radiation-free alternative for assessing osseous structures [5,10]. UTE MRI differs fundamentally from ZTE in that UTE initiates the readout gradient after RF excitation is complete, yielding ultrashort echo times. In contrast, ZTE initiates the readout gradient before the RF pulse, achieving a nominal zero echo time [11].
ZTE MRI has a wide range of applications in musculoskeletal pathology and is highly valuable in settings where detailed osseous assessment is required without ionizing radiation exposure [6]. Locations include the craniofacial region and the skull base, where ZTE (e.g., oZTEo) is routinely used in pediatric patients for disorders such as craniosynostosis, trauma, and fibro-osseous lesions, providing an alternative to CT [9]. In the axial skeleton, ZTE excels at imaging the sacroiliac joints, demonstrating comparable or superior accuracy to low-dose CT for detecting structural lesions, such as erosions, sclerosis, and joint space changes, in conditions like sacroiliitis and axial spondyloarthritis [12]. ZTE is also very useful in post-traumatic conditions for characterizing acute fractures and fracture fragments in the ankle and foot, often providing information on osseous detail and alignment, valuable information for surgical planning, which may avoid the need for supplemental CT imaging [13].
The primary visual similarity reported between ZTE images and CT is that ZTE images exhibit characteristic “CT-like” bone contrast [5]. Since the natively acquired ZTE images initially depict bone as hypointense (dark), post-processing steps, including contrast inversion via inverse-logarithmic rescaling or inverse linear scaling, are applied to render bone structures hyperintense (bright), thereby mimicking the appearance of bone on CT [9]. This CT-like appearance enables accurate differentiation of cortical and medullary bone on ZTE and provides a contrast-to-noise ratio similar to that of CT [14]. Furthermore, ZTE sequences are intrinsically isotropic and three-dimensional (3D), which enables 3D reconstruction and volume rendering similar to CT, proving sufficient information to facilitate preoperative planning, such as measuring complex anatomical features (e.g., glenoid bone loss and hip morphometry), and diagnosing specific osseous pathologies like fractures, erosions, and sclerosis with high diagnostic accuracy comparable to CT [5].
ZTE publications often rely on subjective perception analysis to validate its use as a CT surrogate. However, to our knowledge, quantitative and radiomic analysis of similarities between oZTEo (GEHC-ZTE) and conventional CT of healthy bone has not yet been reported.
Study objective
To quantitatively compare oZTEo MRI and CT using radiomic analysis and identify feature similarities between them, first on normal bone and subsequently on sclerotic and lucent bone lesions.
Patient population
Since July 2025, ZTE/oZTEo has been part of our institutional routine musculoskeletal pelvic MRI protocol across 9 GEHC magnets (two 3T and seven 1.5T). An ongoing prospective cohort includes 26 patients with bone metastases who were screened with oZTEo and CT within six months of each other.
Image processing and feature extraction
Clinical ZTE/oZTEo and CT images were transferred to the institutional Picture Archiving and Communication System (PACS). MR and CT images were retrieved from PACS, and manual volume-of-interest (VOI) segmentations were created from healthy right hips, using the left hip when the right hip was affected by pathology or hardware. The arbitrary VOI included the femoral head, neck, and the greater and lesser trochanters, with an inferior limit drawn as a horizontal plane below the inferior limit of the lesser trochanter. Attention was focused on obtaining a near-exact VOI from CT and oZTEo, with quality assessed using volume measurements. The VOI segmentations were generated by two research assistants, under the supervision of an experienced musculoskeletal radiologist, using MIM software version 7.1.4. The VOIs were subsequently exported from MIM as RT-Struct files for analysis using an in-house-developed Python-based sequence-neutral Cancer Radiomic and Perfusion Imaging (CARPI) automated framework [15], which extracts first- and higher-order radiomic features from different imaging modalities. CARPI extracted a total of 107 radiomic features from each VOI, including 14 shape, 18 first-order, and 75 texture features [15].
Statistical analysis of radiomic features
Each volumetric radiomic feature from oZTEo and CT was standardized across all 26 patients using Z-score standardization (Equation 1):
, (1)
Where x represents the original feature value, while µ and σ represent the mean and standard deviation of the feature distribution, respectively. This process scales each feature distribution to zero mean and unit standard deviation [16], where the resulting z-scores indicate how many standard deviations the feature values are from the mean.
In cases where ZTE was acquired, the standardized ZTE radiomics were subsequently corrected using a -1 multiplier to achieve gray-scale inversion and align them with the CT radiomics. For oZTEo cases (where grey-scale inversion had already been applied via GEHC’s product reconstructions), no further inversion was applied. From here on, for simplicity, we will refer to all grey-scale inverted cases like oZTEo. A total of 107 radiomic features were used to compare oZTEo (n = 26) with CT (n = 26) using two-tailed nonparametric Wilcoxon signed-rank paired tests. A Bonferroni-corrected [17] significance level of p = 0.00047 was used for all tests. All statistical analyses were performed in Python 3.10.13 using SciPy (version 1.12.0) and Scikit-Learn (version 1.4.1).
Intensity histogram analysis
For each patient, the VOI intensity histograms from oZTEo and CT were computed and standardized independently using Z-score standardization (Equation 1). The aggregated intensity histograms across all 26 patients were generated for both modalities before and after standardization. The differences in mean, skewness, kurtosis, and the 10th and 90th percentiles between the oZTEo- and CT-aggregated histograms were compared. Manual measurements of multifocal cortical and marrow-cavity intensities from CT and oZTEo images were obtained for all patients to determine their ranges in the corresponding aggregated intensity histograms and to label them according to the portion of data typically considered clinically relevant by radiologists.
Patient demographics
Eleven (42%) patients were male, and 15 (58%) were female. The average patient age was 50 years (range, 24-76 years).
oZTEo and CT imaging
A total of 22 right and four left hip VOIs were manually segmented on oZTEo and CT scans. The average time between scans was 2 months (range: 1 day to 6 months). The average measured volumes for the 26 CT and 26 oZTEo VOI were 153 ml and 138 ml, respectively, yielding a difference of only 15 ml (< 10%). On visual examination, the intensity of the segmented normal hip appeared very similar in oZTEo and CT, with the cortex being markedly bright relative to the corresponding marrow cavity (Figure 1).
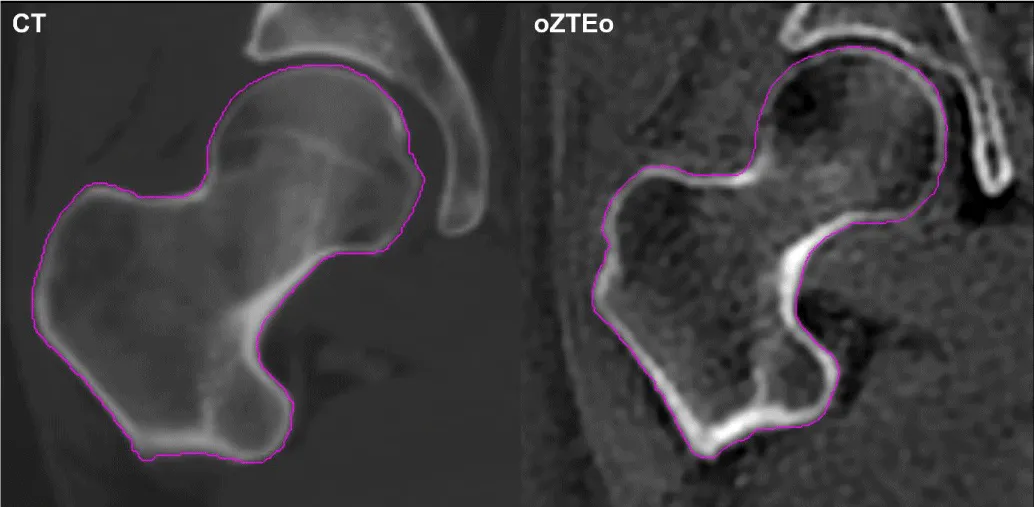
Figure 1: Segmented right hip of a representative patient imaged with CT (left) and oZTEo (right). In both modalities, the cortical region displayed higher intensity than the corresponding marrow cavity.
Radiomic analysis
The statistical analysis of 107 radiomics in oZTEo (n = 26) vs. CT (n = 26) revealed that 100% of features were statistically similar (p > 0.00047) after applying gray-scale inversion to the oZTEo features only (Figure 2).
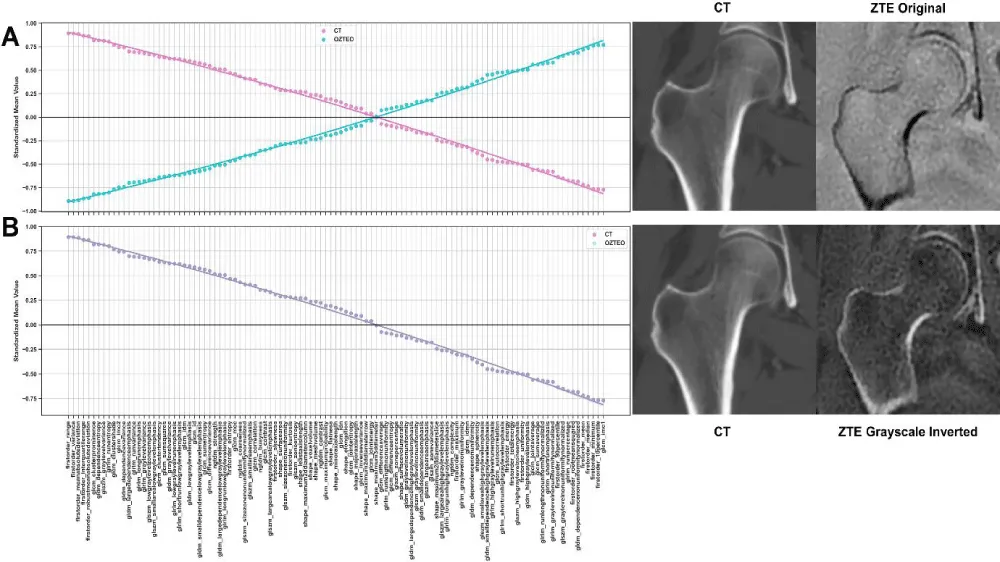
Figure 2: Standardized mean feature values of CT and ZTE radiomics (A) without and (B) with correction of ZTE features by gray-scale inversion. The original ZTE and CT features (A) displayed the same magnitude but in opposite directions. Correction of ZTE feature values yielded complete overlap in radiomic features (B) between the two modalities.
Table 1 presents a summary of the most different and most similar radiomics based on the difference between feature means. The ten most different radiomics included texture features from the GLCM (7), GLRLM (2), and GLSZM (1), while the ten most similar included texture features from the GLCM (2), GLDM (4), GLRLM (1), and first-order features (3). The magnitude of the corrected feature-mean differences was very close to zero (on the order of 10^-13), indicating negligible differences between oZTEo and CT radiomics.
| Table 1. Summary of the most different and the most similar radiomic features in oZTEo vs. CT based on mean difference. | ||
| Most Different Features | Mean Difference | p-Value |
| glcm_idmn | 3.21 x 10⁻¹³ | 0.4834 |
| glcm_idn | 2.55 x 10⁻¹⁴ | 0.7078 |
| glcm_mcc | 1.82 x 10⁻¹⁴ | 0.5651 |
| glrlm_runentropy | 1.73 x 10⁻¹⁴ | 1.0 |
| glrlm_shortrunemphasis | 1.60 x 10⁻¹⁴ | 0.8417 |
| glszm_zoneentropy | 1.37 x 10⁻¹⁴ | 0.9801 |
| glcm_correlation | 1.34 x 10⁻¹⁴ | 0.4525 |
| glcm_sumentropy | 1.17 x 10⁻¹⁴ | 0.9801 |
| glcm_imc2 | 9.99 x 10⁻¹⁵ | 0.4992 |
| glcm_jointentropy | 7.98 x 10⁻¹⁵ | 0.9801 |
| Most Similar Features | ||
| glcm_maximumprobability | 1.11 x 10⁻¹⁶ | 0.3941 |
| gldm_dependencenonuniformitynormalized | 1.11 x 10⁻¹⁶ | 0.7835 |
| glrlm_longrunlowgraylevelemphasis | 1.11 x 10⁻¹⁶ | 0.0594 |
| firstorder_energy | 1.11 x 10⁻¹⁶ | 0.3153 |
| firstorder_range | 1.11 x 10⁻¹⁶ | 0.9801 |
| gldm_largedependencehighgraylevelemphasis | 8.33 x 10⁻¹⁷ | 0.2578 |
| gldm_smalldependencehighgraylevelemphasis | 5.55 x 10⁻¹⁷ | 1.0 |
| glcm_contrast | 5.55 x 10⁻¹⁷ | 0.4082 |
| gldm_graylevelvariance | 0 | 0.8417 |
| firstorder_median | 0 | 0.6348 |
Cortex and marrow cavity samples
The means of the multifocal cortex and marrow intensity bidimensional ROI samples from oZTEo scans were 1,653 ± 729 a.u. and 1,257 ± 691 a.u., respectively, while the means of the cortex and marrow intensity samples from CT scans were 1,148 ± 288 H.U. and 115 ± 110 H.U., respectively. Some overlap (42%) was found between the cortex intensity ranges of oZTEo and CT, while minimal overlap (3%) was observed between their corresponding marrow intensity ranges (Figure 3).
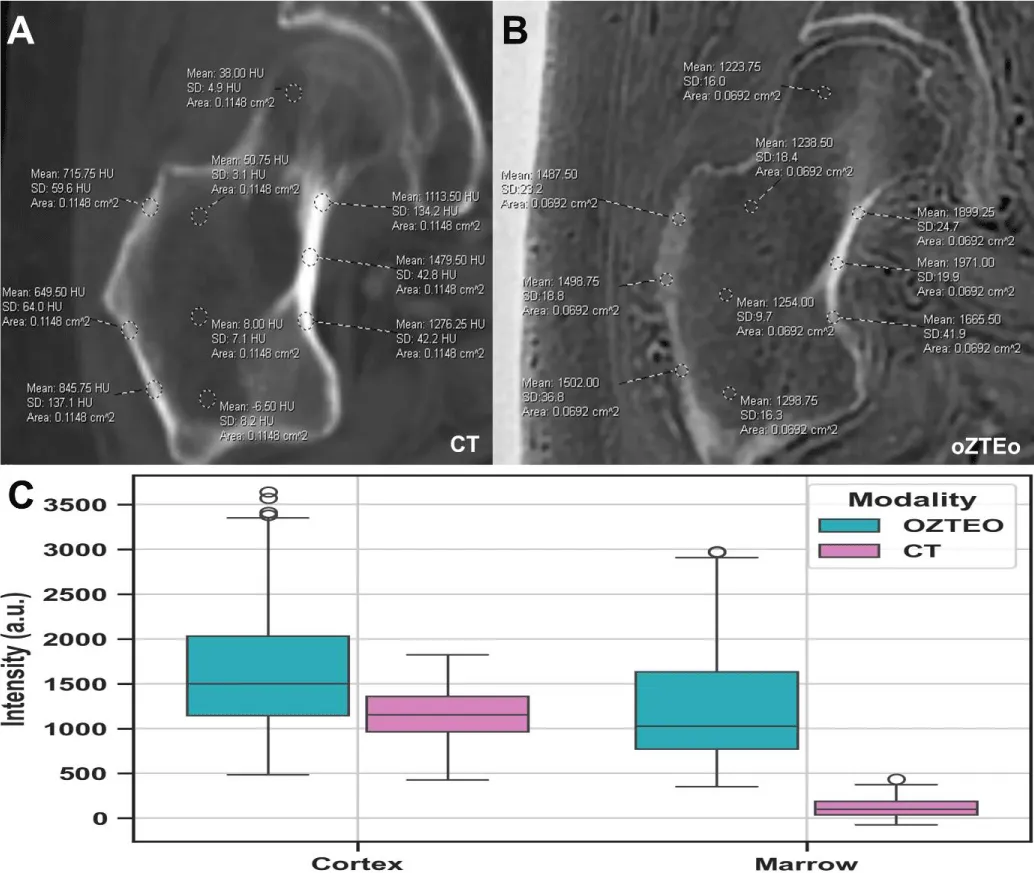
Figure 3: Representative examples of multifocal cortex and marrow intensity measurements manually acquired from (A) oZTEo and (B) CT. Boxplots (C) comparing cortical and marrow intensity measurements in oZTEo vs. CT across all patients showed that cortical ranges overlapped between oZTEo and CT, whereas marrow ranges showed minimal overlap.
Average histogram analysis
Figure 4 compares the aggregated intensity histograms from oZTEo and CT before and after standardization, along with their corresponding cortex and marrow intensity ranges. Before standardization, the percentage differences between the oZTEo and CT histograms for mean, skewness, kurtosis, 10th and 90th percentiles were 324%, -54%, -100%, 1,528%, and 231%, respectively. The histogram area overlap was only 27%, with an overlap between cortex and marrow ranges of 42% and 3%, respectively. After standardization and fitting, the CT and Ozteo histograms significantly aligned, and the histogram differences in mean, skewness, kurtosis, 10th and 90th percentiles decreased significantly to 0%, -10%, -20%, 3%, and 6%, respectively. Additionally, the histogram area increased markedly to 95%, with increased overlap between the cortex and marrow ranges of 84% and 72%, respectively.
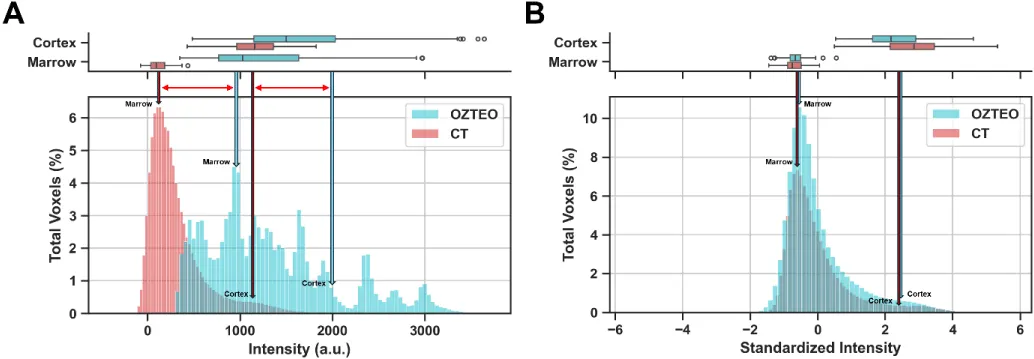
Figure 4: Aggregated oZTEo and CT intensity histograms with corresponding cortex and marrow intensity ranges (A) before and (B) after standardization. The oZTEo and CT standardized histograms showed good alignment, high area overlap, and similar means, skewness, kurtosis, and 10th and 90th percentiles.
The present pilot study statistically compared radiomic features and intensity histograms from oZTEo and CT scans acquired from 26 patients undergoing bone metastasis screening, providing initial quantitative evidence of established image similarities between ZTE/UTE and CT, based on subjective perceptual evaluations reported in the literature.
Hou, et al. [18] measured bone features in 22 patients with lumbar degenerative changes and compared ZTE with conventional MRI, using CT as the reference standard. No significant differences between ZTE and conventional MRI were observed, and ZTE was perceived as blurrier than CT in cortical bone. The inter-reader agreement between CT and ZTE was higher than between CT and conventional MRI. This study concluded that ZTE may show more cortical bone detail than conventional MRI. Lee, et al. [19] used ZTE to assess osseous changes in the temporomandibular joint in 40 joints from 20 patients and compared these findings with CT. The study reported high inter- and intra-observer agreement and reproducibility across various degenerative features. Feuerriegel, et al. [20] studied vertebral fracture detection using a modified UTE sequence and compared it with CT and conventional MRI. They demonstrated accurate detection of all 58 fractures and high agreement with conventional imaging and between readers. Cho, et al. [21] conducted a ZTE clinical feasibility study comparing ZTE with CT in 13 patients with skull fractures. Their results indicated that ZTE is comparable to CT, as no statistically significant differences were observed in fracture detection or skull thickness. De Mello, et al. [22] analyzed 3D ZTE versus 3D CT for assessing glenoid measurements and defects. The study included six cadaver shoulders and 10 patients with glenohumeral instability and demonstrated high inter-rater and inter-modality agreement. Lastly, Jerban S, et al. [23] assessed osteoporosis by analyzing collagen and pore water content in the tibial cortices of female patients using UTE-MRI. They found that estimated water and collagen contents were significantly correlated with total hip (TH) bone densitometry (DEXA) measures. The authors concluded that total proton density, pore water proton density, and macromolecular fraction, as measured by UTE-MRI, may be useful for evaluating individuals with osteopenia and osteoporosis.
Aligned with the previously reported visual-radiologic perceptual similarities observed between ZTE/UTE and CT, our study provides quantitative evidence supporting the conclusion that oZTEo and CT modalities are nearly equivalent in the range and dispersion of radiomic features. Our findings indicated that 100% of standardized radiomic features between oZTEo and CT were statistically similar (with mean differences near zero) after applying gray-scale reversal correction to the ZTE features. The analysis demonstrated that, before gray-scale reversal correction, radiomics from ZTE mirrored those from CT, with the same magnitude but opposite polarity. This difference can be numerically corrected by applying a -1 multiplier to the ZTE features. Therefore, radiomic feature standardization and correction are critical for quantifying the visual similarities between ZTE and CT.
Our findings also demonstrated that quantitative similarities between oZTEo and CT are evident in their derived volumetric intensity histograms. Histogram standardization and fitting were critical for accurately comparing the intensity distributions between the two imaging modalities. This process enabled excellent alignment between the oZTEo and CT intensity histograms, yielding a high overlap area and a mean centered at zero. Additionally, standardization accurately aligned the multifocal cortical and marrow intensity ranges in their respective histograms, enabling visual identification of this portion of the data, which radiologists typically consider relevant for clinical imaging analysis.
oZTEo imaging offers several advantages over CT for PET-CT fusion. It provides bone image contrast comparable to CT/PET-CT at 3D isotropic resolution without ionizing radiation, making it a clinically valuable alternative for pediatric and pregnant patients who may be contraindicated for CT/PET-CT [24]. Additionally, oZTEo may be useful when low-dose CT/PET-CT systems are unavailable, serving as a novel CT surrogate and enabling PET/CT-like PET/MR imaging [24].
Study limitations
Some limitations identified in this study included the nature of a pilot study, with an inherent small sample size in the selected patient cohort (n = 26), and scanner variability across field strengths (1.5T and 3T). Current research efforts to overcome these limitations aim to expand the patient cohort through ongoing prospective accrual and to further validate the impact of different oZTEo field strengths on visual assessment and radiomic analysis.
In summary, this pilot study provides initial quantitative and radiomic evidence of similarities between oZTEo and CT based on objective perception analysis. The quantified overlap between oZTEo and CT demonstrates the potential of oZTEo as a clinically viable alternative to CT when integrated into a standard MR protocol. Further validation of these promising results will include a larger patient cohort and the addition of sclerotic and lytic bone lesions to the analysis.
Detached from subjective perceptual evaluations, radiomic analysis of CT versus oZTEo provided objective quantitative evidence of near-100% similarity in radiomic and histogram analysis, with the range of oZTEo features comparable to that of conventional CT. Subject to subsequent demonstration, our pilot study further builds on the available body of evidence supporting the potential use of oZTEo, which, perhaps when combined with other MRI sequences such as Dixon-fat, diffusion-weighted imaging, and perfusion-weighted imaging, can serve as a “one-stop-shop” radiation-free modality for bone assessment. Based on these promising preliminary results, subsequent research should increase the sample size and conduct a comparative quantitative analysis of features extracted from normal bone versus sclerotic and lytic bone lesions.
Acknowledgment
- The John S. Dunn, Sr. Distinguished Chair in Diagnostic Imaging.
- M.R. Evelyn Hudson Foundation Endowed Professorship.
- General Electric Healthcare (GEHC).
- Aydingoz U, Yildiz AE, Ergen FB. Zero echo time musculoskeletal MRI: technique, optimization, applications, and pitfalls. Radiographics. 2022;42(5):1398-1414. Available from: https://doi.org/10.1148/rg.220029
- Wiesinger F, Ho ML. Zero-TE MRI: principles and applications in the head and neck. Br J Radiol. 2022;95(1136):20220059. Available from: https://doi.org/10.1259/bjr.20220059
- Sandberg JK, Young VA, Yuan J, Hargreaves BA, Wishah F, Vasanawala SS. Zero echo time pediatric musculoskeletal magnetic resonance imaging: initial experience. Pediatr Radiol. 2021;51(13):2549-2560. Available from: https://doi.org/10.1007/s00247-021-05125-5
- Breighner RE, Endo Y, Konin GP, Gulotta LV, Koff MF, Potter HG. Technical developments: zero echo time imaging of the shoulder: enhanced osseous detail by using MR imaging. Radiology. 2018;286(3):960-966. Available from: https://doi.org/10.1148/radiol.2017170906
- Vuillemin V, Guerini H, Thévenin F, Sibileau E, Corcos G, Khaled W. Bone tissue in magnetic resonance imaging: contribution of new zero echo time sequences. Semin Musculoskelet Radiol. 2023;27(4):411-420. Available from: https://doi.org/10.1055/s-0043-1770771
- Fujisaki A, Tsukamoto J, Narimatsu H, Hayashida Y, Todoroki Y, Hirano N, et al. Zero echo time magnetic resonance imaging: techniques and clinical utility in musculoskeletal system. J Magn Reson Imaging. 2024;59(1):32-42. Available from: https://doi.org/10.1002/jmri.28843
- Lockard CA, Damon BM, Serrai H. Ultrashort-T2* mapping at 7 tesla using an optimized pointwise encoding time reduction with radial acquisition (PETRA) sequence at standard and extended echo times. PLoS One. 2025;20(4):e0310590. Available from: https://doi.org/10.1371/journal.pone.0310590
- Kassey VB, Walle M, Egan J, Yeritsyan D, Beeram I, Kassey SP, et al. Quantitative (1)H magnetic resonance imaging on normal and pathologic rat bones by solid-state (1)H ZTE sequence with water and fat suppression. J Magn Reson Imaging. 2024;60(6):2423-2432. Available from: https://doi.org/10.1002/jmri.29361
- Breighner RE, Potter HG. CT-like contrast for bone imaging with ZTE-MRI. In: MRI of short- and ultrashort-T2 tissues. Cham: Springer International Publishing; 2024. p. 549-559. Available from: https://doi.org/10.1007/978-3-031-35197-6_44?urlappend=%3Futm_source%3Dresearchgate.net%26utm_medium%3Darticle
- Aydıngöz Ü, Yıldız AE, Ergen FB. Zero echo time musculoskeletal MRI: technique, optimization, applications, and pitfalls. Radiographics. 2022;42(5):1398-1414. Available from: https://doi.org/10.1148/rg.220029
- Hwang JY, Yun H, Yoon IN, Chang MY. ZTE MRI improves detection of calcific deposits and differentiation between resorptive and formative phases in calcific tendinitis of shoulder. Sci Rep. 2025;15(1):12084. Available from: https://doi.org/10.1038/s41598-025-91983-0
- Rai P, Janu AK, Shetty N, Kulkarni S. Current landscape of short-T2 imaging techniques in the musculoskeletal system: the past, present and future. J Magn Reson Imaging. 2025;62(4):969-985. Available from: https://doi.org/10.1002/jmri.29776
- Sahr ME, Breighner RE, Burge AJ, Nwawka OK, Konin GP, Helfet DL, et al. Utility of zero echo time MRI for the diagnosis and characterization of ankle fractures. HSS J. 2024;20(4):502-507. Available from: https://doi.org/10.1177/15563316231187383
- Getzmann JM, Deininger-Czermak E, Melissanidis S, Ensle F, Kaushik SS, Wiesinger F, et al. Deep learning-based pseudo-CT synthesis from zero echo time MR sequences of the pelvis. Insights Imaging. 2024;15(1):202. Available from: https://doi.org/10.1186/s13244-024-01751-3
- Sierra ED, Valenzuela R, Canjirathinkal MA, Costelloe CM, Moradi H, Madewell JE, et al. Cancer radiomic and perfusion imaging automated framework: validation on musculoskeletal tumors. JCO Clin Cancer Inform. 2024;8:e2300118. Available from: https://doi.org/10.1200/cci.23.00118
- Demircioğlu A. The effect of feature normalization methods in radiomics. Insights Imaging. 2024;15(1):2. Available from: https://doi.org/10.1186/s13244-023-01575-7
- Weisstein EW. Bonferroni correction. 2004. Available from: https://mathworld.wolfram.com/BonferroniCorrection.html
- Hou B, Liu C, Li Y, Xiong Y, Wang J, Zhang P, et al. Evaluation of the degenerative lumbar osseous morphology using zero echo time magnetic resonance imaging (ZTE-MRI). Eur Spine J. 2022;31(3):792-800. Available from: https://doi.org/10.1007/s00586-021-07099-2
- Lee C, Jeon KJ, Han SS, Kim YH, Choi YJ, Lee A, et al. CT-like MRI using the zero-TE technique for osseous changes of the TMJ. Dentomaxillofac Radiol. 2020;49(3):20190272. Available from: https://doi.org/10.1259/dmfr.20190272
- Feuerriegel GC, Kronthaler S, Boehm C, Renz M, Leonhardt Y, Gassert F, Foreman SC, et al. Diagnostic value of water-fat-separated images and CT-like susceptibility-weighted images extracted from a single ultrashort echo time sequence for the evaluation of vertebral fractures and degenerative changes of the spine. Eur Radiol. 2023;33(2):1445-1455. Available from: https://doi.org/10.1007/s00330-022-09061-2
- Cho SB, Baek HJ, Ryu KH, Choi BH, Moon JI, Kim TB, et al. Clinical feasibility of zero TE skull MRI in patients with head trauma in comparison with CT: a single-center study. AJNR Am J Neuroradiol. 2019;40(1):109-115. Available from: https://doi.org/10.3174/ajnr.a5916
- de Mello RAF, Ma YJ, Ashir A, Jerban S, Hoenecke H, Carl M, et al. Three-dimensional zero echo time magnetic resonance imaging versus 3-dimensional computed tomography for glenoid bone assessment. Arthroscopy. 2020;36(9):2391-2400. Available from: https://doi.org/10.1016/j.arthro.2020.05.042
- Jerban S, Ma Y, Wei Z, Shen M, Ibrahim Z, Jang H, et al. Ultrashort echo time MRI detects significantly lower collagen but higher pore water in the tibial cortex of female patients with osteopenia and osteoporosis. J Bone Miner Res. 2024;39(6):707-716. Available from: https://doi.org/10.1093/jbmr/zjae053
- Carl M, Peters R, Carlson E, Wang K, Fung M. oZTEo: enabling MR as a one-stop shop for soft tissue and bone imaging. 2023. Available from: https://signapulse.gehealthcare.com/autumn-2021/ozteo-mr-imaging-technique-benefits