
More Information
Submitted: February 20, 2026 | Accepted: February 26, 2026 | Published: February 27, 2026
Citation: Sapna, Thakur V, Chhabra N, Singh G, Aggarwal N, Sharma B, et al. Diagnostic Utility of Diffusion-Weighted Magnetic Resonance Imaging in Differentiating Benign and Malignant Focal Liver Lesions. J Radiol Oncol. 2026; 10(1): 024-029. Available from:
https://dx.doi.org/10.29328/journal.jro.1001089
DOI: 10.29328/journal.jro.1001089
Copyright license: © 2026 Sapna, et al. This is an open access article distributed under the Creative Commons Attribution License, which permits unrestricted use, distribution, and reproduction in any medium, provided the original work is properly cited.
Keywords: Malignant bone tumors; Focal liver lesions; Apparent diffusion coefficient; MRI; Hepatic tumors

Diagnostic Utility of Diffusion-Weighted Magnetic Resonance Imaging in Differentiating Benign and Malignant Focal Liver Lesions
Sapna1, Vijay Thakur1, Neha Chhabra2*, Gurjinder Singh3, Neeti Aggarwal1, Brij Sharma1 and Gopal Singh1
1Indira Gandhi medical College, Shimla, Himachal Pradesh, India
2Sohana Multispecialty Hospital, Mohali, Punjab, India
3Max Superspeciality Hospital, Mohali, Punjab, India
*Corresponding author: Dr. Neha Chhabra, Sohana Multispecialty Hospital, Mohali, Punjab, India, Email: [email protected]
Background: Accurate characterization of focal liver lesions (FLLs) is essential for appropriate staging in oncologic patients and to avoid unnecessary invasive procedures in benign conditions. Diffusion-weighted magnetic resonance imaging (DWI) provides functional information regarding tissue cellularity through apparent diffusion coefficient (ADC) measurements and may improve differentiation between benign and malignant lesions without the need for contrast administration.
Objective: To determine the diagnostic utility of diffusion-weighted magnetic resonance imaging in differentiating benign and malignant focal liver lesions and to establish an optimal ADC cut-off value for lesion characterization.
Methods: This cross-sectional study was conducted over one year at a tertiary care center. Twenty-eight patients with ultrasound-detected FLLs (≥1 cm) underwent MRI on a 1.5T system. Imaging protocol included conventional sequences and DWI with b - values of 0, 400, and 800 s/mm². Qualitative assessment was performed using signal intensity on DWI and ADC maps. Quantitative evaluation was done by calculating mean ADC values using region-of-interest (ROI) measurements. Histopathology and/or operative findings served as the reference standard where applicable.
Results: Thirty-four focal liver lesions were analyzed (13 benign, 21 malignant). Qualitative DWI at b - 800 showed an overall accuracy of 67.6%. ADC map analysis significantly improved diagnostic accuracy to 94.1% (p < 0.001). Mean ADC value for malignant lesions (0.90 ± 0.15 × 10-³ mm²/s) was significantly lower than that of benign lesions (2.19 ± 0.29 × 10-³ mm²/s) (p < 0.001). ADC cut-off ranged from 0.68 – 1.21 × 10-³ mm²/s for malignant lesions and 1.21 – 3.38 × 10-³ mm²/s for benign lesions. Overall accuracy of DWI compared with histopathology was 96.43%.
Conclusion: DWI is a valuable adjunct in liver MRI protocols for differentiating benign and malignant FLLs. Quantitative ADC measurement significantly enhances diagnostic performance over qualitative assessment alone. DWI should be interpreted in conjunction with conventional MRI sequences and clinical findings for optimal accuracy.
Focal liver lesions (FLLs) are commonly encountered in clinical practice. Their accurate characterization is crucial for oncologic staging, therapeutic planning, and avoidance of unnecessary biopsy in benign lesions. While ultrasonography is sensitive for lesion detection, its specificity remains limited. Contrast-enhanced computed tomography (CT) and magnetic resonance imaging (MRI) are routinely used for further characterization.
MRI offers superior soft tissue contrast resolution and avoids ionizing radiation. With the advent of diffusion-weighted imaging (DWI), MRI now provides functional information in addition to morphological assessment. DWI evaluates the random Brownian motion of water molecules within tissues. In highly cellular tissues, such as malignant tumors, diffusion is restricted due to increased cellular density and reduced extracellular space, resulting in low apparent diffusion coefficient (ADC) values. In contrast, cystic or necrotic lesions demonstrate relatively free diffusion and high ADC values.
DWI is rapid, non-invasive, and does not require contrast administration. It is particularly valuable in patients with renal insufficiency or contrast allergies. Several studies have suggested that ADC values can help differentiate benign from malignant focal liver lesions; however, ADC thresholds vary depending on scanner parameters and institutional settings.
The present study was conducted to evaluate the diagnostic performance of DWI in differentiating benign and malignant FLLs and to determine an optimal ADC cut-off value using a 1.5 Tesla MRI system.
This cross-sectional study was conducted in the Department of Radio-Diagnosis at Indira Gandhi Medical College and Hospital over a period of one year, from July 2018 to June 2019, after obtaining approval from the institutional ethics committee. The study population comprised patients referred from the Departments of Medicine and Surgery who were found to have focal liver lesions (FLLs) measuring 1 cm or more on ultrasound examination. Patients of all age groups who were willing to participate were included in the study. Individuals with absolute contraindications to magnetic resonance imaging (MRI), those with severe claustrophobia, and patients who declined participation were excluded.
MRI examinations were performed using a 1.5 Tesla Avanto system (Siemens, Germany). The imaging protocol included T2-weighted HASTE sequences in axial and coronal planes, T2-weighted True FISP, T1-weighted VIBE, and dynamic contrast-enhanced T1-weighted VIBE sequences with fat suppression. Diffusion-weighted imaging (DWI) was acquired using b - values of 0, 400, and 800 s/mm². Apparent diffusion coefficient (ADC) maps were automatically generated using the vendor-provided software.
All images were analyzed on a dedicated workstation. For each lesion, parameters such as location and size, signal intensity on T1-weighted and T2-weighted images, contrast enhancement pattern, signal characteristics on diffusion-weighted imaging (b = 800 s/mm²), and corresponding findings on ADC maps were evaluated. The mean ADC value for each lesion was calculated by placing a region of interest (ROI) over more than 50% of the lesion area, while carefully excluding necrotic components.
Lesions were categorized based on diffusion characteristics. Malignant lesions were identified by hyperintensity on high b - value (b - 800) images, hypointensity on ADC maps, and low ADC values consistent with diffusion restriction. In contrast, benign lesions typically demonstrated reduced signal intensity on b - 800 images or features of T2 shine-through, appeared hyperintense on ADC maps, and exhibited higher ADC values. Histopathological examination and/or operative findings were considered the reference standard wherever available.
Statistical analysis was carried out using Pearson’s chi-square test and paired t - test. A p - value of less than 0.05 was considered statistically significant.
A total of 28 consecutive patients had 34 FLLs with an average diameter of 4.7 cm (range from 1.2 to 18 cm), met all of the inclusion criteria, 17 males (60.7%) and 11 females (39.2%), ranging in age from 28 to 82 years old, with a maximum in the > 60 years age group.
There were 21 malignant FLLs (13 metastases, 2 HCC, 3 Intrahepatic Cholangiocarcinomas, and 3 Ca Gall bladder with liver infiltration) and 13 benign liver lesions (6 hemangiomas, 4 simple hepatic cysts, 2 hydatid cysts, and 1 FNH). None of the patients simultaneously had benign and malignant liver lesions. 2 patients had liver cirrhosis, and 6 patients had primary malignancy (2 cancer, 2 rectum carcinoma, and one cervical cancer, one with unknown primary). The remaining patients, who had no history of malignancy or chronic liver disease, underwent MR imaging for further evaluation of FLLs diagnosed by CT and or US.
Out of 13 benign FLLs, 11 lesions showed hyperintense SI and 2 lesions showed decreased hyperintensity on DWI (at b - value - 800 s/mm2). While all malignant FLL’s (i.e., n = 21) showed hyperintense SI on DWI. Analysis of signal intensity on the b - 800 showed statistically insignificant difference between benign and malignant FLLs (p - value -0.064), with sensitivity and specificity of hyper intensity for malignant FLLs were 100% and 15.3% respectively while decreased hyper intensity showed sensitivity and specificity for benign FLLs of 100% and 65.6% respectively. The overall accuracy of qualitative DW images for FLLs characterization was 67.6% Table 1.
| Table 1: Signal intensity and accuracy of DWI at b value-800s/mm2 for differentiating benign and malignant FLLs. | ||||||
| Lesion type | Signal Intensity on DWI at value b-800s/mm2 | Chi-square value | p - value | Overall accuracy | ||
| Hyper intense | Decreased hyperintensity | Total | ||||
| n (%) | n (%) | n (%) | 67.6% | |||
| Benign FLLs | 11 (84.6) | 2 (15.4) | 13 (100.0) | 3.433 | 0.064 NS |
|
| Malignant FLLs | 21 (100.0) | 0 (0.0) | 21 (100.0) | |||
| Statistical Analysis: Pearson’s chi-square test. Statistically significant if p < 0.05. n - number of lesions. | ||||||
Out of 13 benign FLLs, 11 (86.4%) lesions showed hyperintense SI and 2 (15.4%) lesions showed hypointense SI (i.e., diffusion restriction) on ADC map. All malignant FLLs showed hypo-intense SI (i.e., diffusion restriction) on the ADC map. Analysis of signal intensity on the ADC map showed that hypo intensity on the ADC map is 86.6% specific for malignant FLLs diagnosis. On the other hand specificity of hyperintensity on the ADC map for benign FLLs was 100%. The overall accuracy of the ADC map in FLLs characterization was 94.1% Table 2.
| Table 2: Signal intensity and accuracy of ADC map for differentiation between benign and malignant FLLs. | ||||||
| Lesion type | Signal intensity on ADC map | Chi-square value | p - value | Overall accuracy | ||
| Hyper intense | Hypo intense | Total | ||||
| n (%) | n (%) | n (%) | ||||
| Benign FLLs | 11 (84.6) | 2 (15.4) | 13 (100.0) | 26.268 | <0.001 S |
94.1% |
| Malignant FLLs | 0 (0.0) | 21 (100.0) | 21 (100.0) | |||
| Statistical Analysis: Pearson’s chi-square test. Statistically significant if p < 0.05. n - number of lesions. | ||||||
Mean ADC values of malignant lesions (0.90 ± 0.15 x 10⁻³ mm2/s) were significantly lower than those of benign lesions (2.19 ± 0.29 x 10⁻³ mm2/s). The difference between the mean ADC values of benign and malignant lesions was statistically significant (p < 0.05) as depicted in Table 3.
| Table 3: Mean comparison of ADC Value (10-3s/mm2) between Malignant and Benign FLLs. | ||||
| MRI Diagnosis | ADC Value (10-3 mm2/s) | t - value | p - value | |
| MEAN | SD | |||
| Malignant | 0.91 | 0.15 | 5.028 | < 0.001 S |
| Benign | 2.19 | 0.29 | ||
| Statistical Analysis: Paired t - test. Statistically significant if p < 0.05. | ||||
The mean ADC value of different benign and malignant FLLs is depicted in Table 4. Among malignant FLLs, the lowest ADC value was for HCC, i.e. 0.86 ± 0.11 x 10⁻³ mm2/s and among benign FLLs, the highest ADC value was for simple hepatic cyst, i.e., 2.66 ± 0.32 x 10⁻³ mm2/s. In malignant FLLs, the primary hepatic tumor (HCC) had a lower mean ADC value (0.86 x 10⁻³ mm2/s) than the metastatic liver tumor (0.90 x 10⁻³ mm2/s).
| Table 4: Mean ADC Value (10-3mm2/s) of FLLs. | |
| Type of Lesion (number) | ADC value (×10−3 mm2/s) |
| Malignant (n = 21) | 0.91 ± 0.15(0.68-1.21) |
| HCC (n = 2) | 0.86 ± 0.11(0.812-0.912) |
| Metastases (n = 13) | 0.90 ± 0.14(0.68-1.21) |
| Ca GB with Liver Infiltration (n = 3) | 0.92 ± 0.17(0.86-0.96) |
| Intrahepatic Cholangiocarcinoma (n = 3) | 0.91 ± 0.19(0.90-0.94) |
| Benign(n = 13) | 2.19 ± 0.29(0.20-3.38) |
| Hemangioma (n = 6) | 1.82 ± 0.22(1.63-1.98) |
| Simple Hepatic Cysts (n = 4) | 2.66 ± 0.32(2.39-3.13) |
| Hydatid Cysts (n = 2) | 2.54 ± 0.40(1.71-3.38) |
| FNH (n = 1) | 1.21 ± 0.20 |
| Note: HCC; Hepatocellular Carcinoma, FNH; Focal Nodular Hyperplasia, ADC values are expressed as the mean ± Standard deviation (lowest - highest). | |
By comparing DWMRI results with histopathological results in malignant FLLs sensitivity, specificity, positive predictive value, negative predictive value, and accuracy were calculated for malignant FLLs as shown in Table 5. Overall accuracy of detection of malignant lesions on DWMRI in comparison to histopathology is 96.43% as one case, which was diagnosed as benign (cholangitic abscess) on MRI came out to be malignant (metastases) on histopathology.
| Table 5: Showing comparison of DWMRI results with histopathological results in Malignant FLLs. | |||||
| MRI | Histopathology | Total | |||
| Malignant FLL | |||||
| Present | n | Absent | n | ||
| Positive | True Positive | a = 18 | False Positive | c = 0 | a+c = 18 |
| Negative | False Negative | b = 1 | True Negative | d = 9 | b+d = 10 |
| Total | a+b= 19 | c+d = 9 | |||
| Statistic | Sensitivity | Specificity | PPV | NPV | Accuracy |
| 94.74% | 100.00% | 100.00% | 90.00% | 96.43% | |
| PPV: Positive Predictive Value; NPV: Negative Predictive Value; n - number of patients. | |||||
Similarly, by comparing DWMRI results with histopathological results in benign FLLs, sensitivity, specificity, positive predictive value, negative predictive value, and accuracy were calculated for benign FLLs as shown in Table 6. Overall accuracy of detection of benign FLLs on DWMRI in comparison to histopathology is 96.43%.
| Table 6: Showing comparison of DWMRI results with histopathological results in benign FLLs. | |||||
| MRI | Histopathology | Total | |||
| Benign FHL | |||||
| Present | n | Absent | n | ||
| Positive | True Positive | a = 9 | False Positive | c = 1 | a+c = 10 |
| Negative | False Negative | b = 0 | True Negative | d = 18 | b+d = 18 |
| Total | a+b = 9 | c+d = 19 | |||
| Statistic | Sensitivity | Specificity | PPV | NPV | Accuracy |
| 100.00% | 94.74% | 90.00% | 100.00% | 96.43% | |
| PPV: Positive Predictive Value; NPV: Negative Predictive Value; n - number of patients. | |||||
The liver is a vital abdominal organ that can be affected by a wide spectrum of benign and malignant pathologies, including both primary and secondary lesions. In non-cirrhotic livers, the majority of focal liver lesions (FLLs) are benign. The most common solid benign lesions include hemangiomas, hepatic adenomas, and focal nodular hyperplasia (FNH), whereas metastases are the most frequently encountered malignant lesions. Primary malignancies such as hepatocellular carcinoma (HCC) and intrahepatic cholangiocarcinoma are typically associated with chronic liver disease [1]. In most cases, FLLs can be differentiated based on their characteristic imaging features; however, atypical lesions may present diagnostic challenges and often require histopathological confirmation [2].
In routine clinical practice, focal liver lesions are initially
evaluated using ultrasonography and/or computed tomography. Ultrasound has high sensitivity for lesion detection but relatively low specificity for lesion characterization, ranging between 30% and 60%. The use of contrast-enhanced ultrasound (CEUS) has significantly improved specificity for differentiating benign from malignant lesions. Nevertheless, magnetic resonance imaging (MRI) remains the preferred modality for further lesion characterization due to its superior soft tissue contrast, multiplanar capability, absence of ionizing radiation, and safer contrast profile compared to iodinated agents [2]. Furthermore, MRI has been shown to have higher sensitivity for detecting HCC in cirrhotic livers compared to computed tomography and ultrasound [1].
Diffusion-weighted magnetic resonance imaging (DW-MRI) has emerged as an important tool in the evaluation of both focal and diffuse liver diseases. It can be easily incorporated into routine MRI protocols, requires relatively short acquisition time, and does not require contrast administration, making it particularly useful in patients with renal impairment at risk for nephrogenic systemic fibrosis [3]. DW-MRI assesses the random motion of water protons within tissues, thereby reflecting tissue cellularity and membrane integrity. Highly cellular tissues, such as malignant tumors, restrict water diffusion due to increased cellular density and reduced extracellular space, resulting in diffusion restriction. In contrast, cystic or necrotic lesions allow relatively free diffusion of water molecules and therefore do not exhibit restriction [3]. Apparent diffusion coefficient (ADC) values provide a quantitative measure of this diffusion and are useful for lesion characterization.
In the present study, both qualitative (signal intensity on DWI and ADC maps) and quantitative (ADC values) parameters were used to differentiate benign from malignant FLLs. Imaging was performed using three b - values (0, 400, and 800 s/mm²), in agreement with previous studies [4,5]. Although some studies suggest that at least two b - values are sufficient for ADC calculation, the use of multiple b - values may improve lesion characterization at the expense of increased scan time [3]. In our study, visual assessment based on lesion morphology and signal characteristics at b - values of 0, 400, and 800 s/mm2 demonstrated an overall diagnostic accuracy of 67.6%, which was lower than that reported by Hasan, et al. [1] and Parikh, et al. [4]. Additionally, signal intensity analysis on high b - value images (b = 800 s/mm²) did not show a statistically significant difference between benign and malignant lesions, unlike findings reported in earlier studies [1]. This discrepancy may be attributed to known limitations of diffusion-weighted imaging, including the hypercellular nature of FNH [6] and the presence of slow-flowing blood in hemangiomas [7], both of which can mimic diffusion restriction. Furthermore, the T2 shine-through phenomenon was observed in a substantial proportion of benign lesions, particularly cysts and hemangiomas.
The T2 shine-through effect refers to lesions that appear hyperintense on diffusion-weighted images due to prolonged T2 relaxation rather than true restriction of diffusion. This can be differentiated by correlating with ADC maps, where such lesions demonstrate high ADC values, indicating facilitated diffusion [3]. In the present study, the use of ADC maps significantly improved diagnostic accuracy to 94.1%, with a statistically significant difference between benign and malignant lesions, consistent with findings reported by Hasan, et al. [1]. These observations emphasize that diffusion-weighted images should always be interpreted alongside ADC maps and conventional MRI sequences to avoid diagnostic errors.
Several studies have demonstrated that ADC values can be used to differentiate benign from malignant liver lesions, although variability exists due to differences in imaging techniques, b - values, and lesion types [8,9]. In general, malignant lesions exhibit lower ADC values compared to benign lesions due to restricted diffusion caused by high cellularity. However, overlap may occur, as some benign lesions with high cellularity may also show low ADC values, while necrotic or cystic malignant lesions may demonstrate higher ADC values [3].
In our study, hepatic cysts demonstrated the highest ADC values, followed by hemangiomas, whereas malignant lesions such as HCC and metastases showed significantly lower ADC values. The mean ADC values of malignant lesions were significantly lower (0.90 ± 0.15 × 10⁻³ mm2/s) (Figures 1,2,4) than those of benign lesions (2.19 ± 0.29 × 10⁻³ mm2/s) (Figure 3), and this difference was statistically significant, in agreement with previous studies [10]. However, no significant difference was observed between primary (0.89 ± 0.15 × 10⁻³ mm2/s) and metastatic malignant lesions (0.90 ± 0.14 × 10⁻³ mm2/s), which may be attributed to the relatively small sample size.
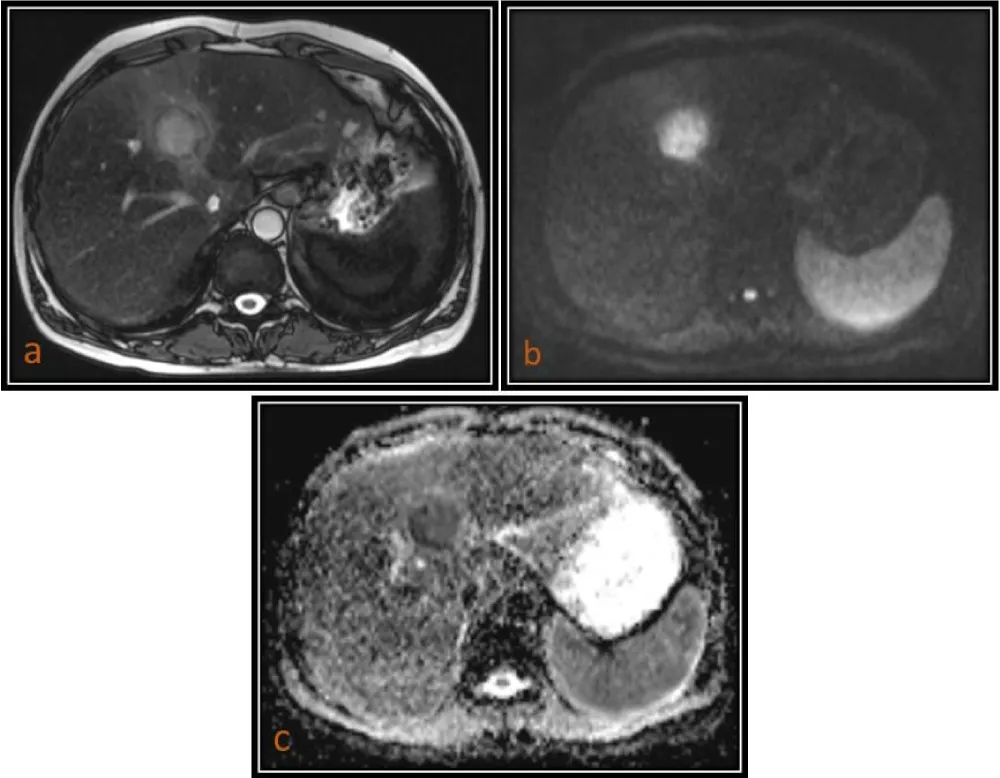
Figure 1: 54 year-oldmale patient with HCC. (a) Axial T2(TruFISP)-weighted image shows a hyperintense lesion in segment IVa of the liver, which is markedly hyperintense on DWI (b = 800) as seen in image (b) and hypointense on ADC map as seen in image (c) with a low ADC value (0.912 x 10 mm2/s).

Figure 2: 65-year-old male patient with Intrahepatic Cholangiocarcinoma. (a) Axial T2(TruFISP)-weighted image shows a slightly hyperintense lesion in the right lobe of the liver, which is hyperintense on DWI (b = 800) as seen in image (b) and isointense to hypointense on the ADC map as seen in image (c)with a low ADC value (0.903 x 10⁻³ mm2/s).
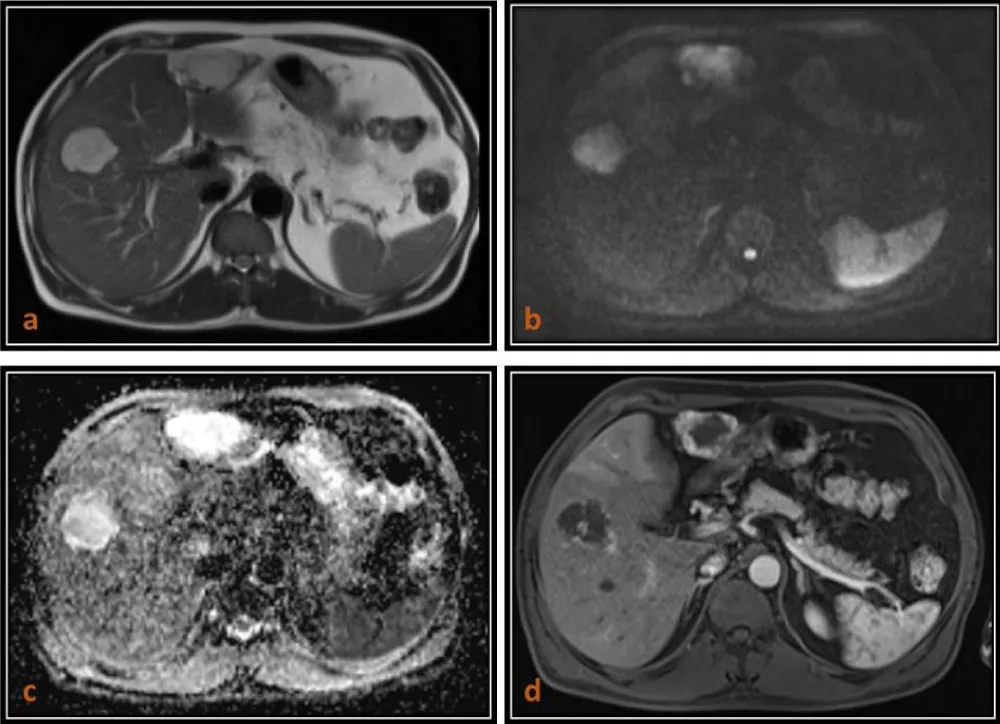
Figure 3: 63-year-old male patient with Liver hemangiomas. (a) Axial T2 (TruFISP)-weighted image shows two hyperintense lesions in the both lobes of liver which are hyperintense (T2 shine-through) on axial DW image (b = 800) as seen in (b), and remain hyperintense on ADC map with a high ADC value (1.846 x 10⁻³ mm2/s) as seen in (c) and shows peripheral puddling on T1 (VIBE) post contrast arterial phase images.
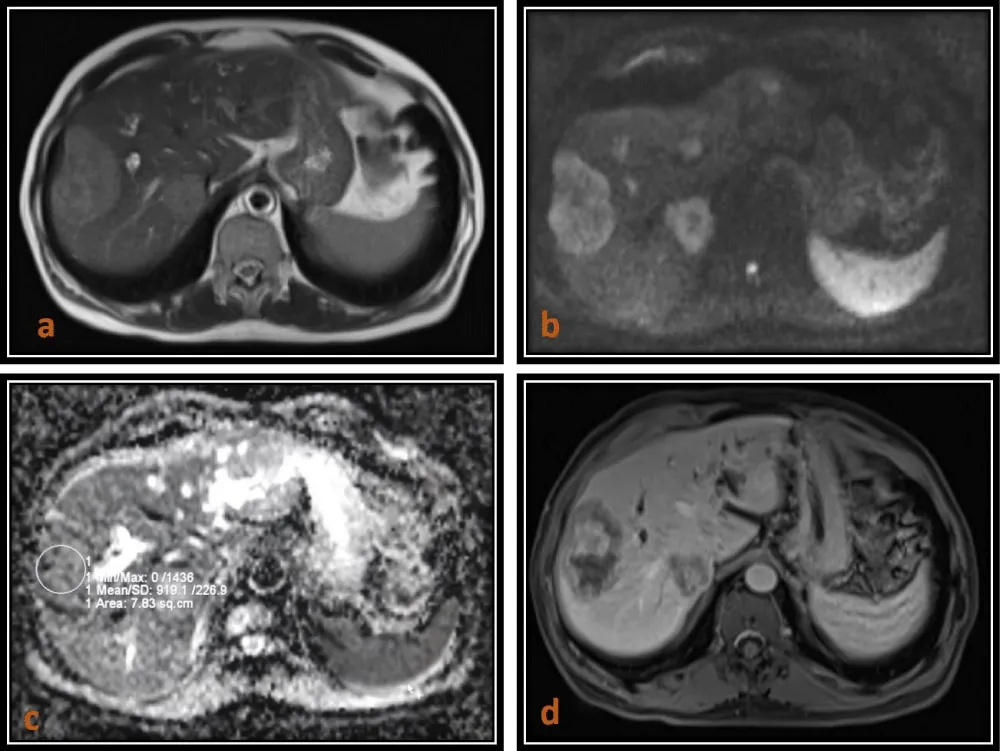
Figure 4: 66-year-old male patient who is a known case of Carcinoma rectum with metastases to the liver. (a) Axial T2 (HASTE)-weighted image shows two mildly hyperintense lesions in right lobe which are moderately hyperintense on WI (b = 800) images as seen in (b) and areisointense with thin hypointense rim on ADC map with low ADC value (0.91 x 10⁻³ mm2/s) as seen in (c) and shows heterogenous enhancement on T1 (VIBE) post contrast images as seen in (d).
Determination of an optimal ADC cut-off value is crucial and the most challenging task for differentiating benign from malignant lesions. Previous studies have reported cut-off values ranging from 1.4 to 1.6 × 10⁻³ mm²/s, with sensitivity ranging from 74% to 100% and specificity from 77% to 100% [4,11-13]. In our study, the ADC values for malignant lesions ranged from 0.68 to 1.21 × 10⁻³ mm²/s, whereas benign lesions demonstrated higher values of 1.21 - 3.38 x 10⁻³ mm2/s. The variation in cut-off values compared to other studies may be explained by differences in sample size, imaging parameters, and lesion distribution.
Several studies have claimed that DWI can differentiate between benign and malignant lesions based on ADC measurements [14-16]. This finding was based on the ADC of hemangiomas and cysts being significantly higher than that of metastases and hepatocellular cancer. However, the specificity decreased by exclusion of cysts and hemangiomas, suggesting that the ADC cut-off is not as effective in the differentiation of malignant lesions from FNHs and adenomas.
Although diffusion-weighted imaging is useful for lesion characterization, it is not always necessary for diagnosing simple cysts and hemangiomas, as these can often be reliably identified using conventional T2-weighted and contrast-enhanced MRI sequences [7]. The greater diagnostic challenge lies in differentiating benign solid lesions such as FNH and adenomas from malignant tumors. In the present study, this distinction was limited due to the small number of such cases.
Overall, diffusion-weighted MRI demonstrated high diagnostic performance in our study, with an accuracy of 96.43% in differentiating benign and malignant focal liver lesions when compared with histopathology. The sensitivity and specificity for malignant lesions were 94.74% and 100%, respectively, while for benign lesions, sensitivity was 90% and specificity was 100%. A discrepancy was noted in one case where imaging findings suggested a cholangitic abscess, whereas histopathological examination confirmed metastasis, likely due to overlapping ADC values.
These findings support the role of diffusion-weighted MRI as a reliable, non-invasive imaging modality for the characterization of focal liver lesions, particularly when interpreted in conjunction with conventional MRI sequences and quantitative ADC analysis.
Limitations
The sample size was small, especially for the benign solid hepatocellular lesions, a lack of cases of adenomas, and only one case of FNH, thus making the comparison between solid benign and malignant masses limited. Also, the comparison between primary malignant and metastatic FLLs could not be made because of the smaller number of primary malignant FLLs. The study was conducted in a heterogeneous patient group with a large variety of primary malignancies instead of a highly selected population with only one malignancy. However, this patient group is representative of the clinical referrals of patients in our institution.
DWI is a useful tool for FLLs’ characterization. DWI is a problem-solving sequence in patients with contraindications to contrast media. Qualitative DWI assessment is not sufficient alone and should be combined with quantitative ADC value calculation. DWI should be included in routine liver MR protocols; however, because of its known pitfalls and limitations, mainly the substantial overlap in the range of ADCs between benign and malignant lesions, it should be interpreted in combination with clinical history and conventional sequences, including contrast-enhanced MRI. However, more studies with more variants of hepatic focal lesions are needed for more evaluation of DWI in the characterization of hepatic masses.
- Hasan NM, Zaki KF, Alam-Eldeen MH, Hamedi HR. Benign versus malignant focal liver lesions: Diagnostic value of qualitative and quantitative diffusion weighted MR imaging. Egypt J Radiol Nucl Med. 2016;47(4):1211-1220. Available from: https://doi.org/10.1016/j.ejrnm.2016.08.009
- Abdelsamed AM, Elia RZ, Hatim MU. The role of diffusion weighted MRI in the differentiation between benign and malignant hepatic focal lesions. Egypt J Hosp Med. 2017;68(2):1176-1183. Available from: https://www.ejhm.journals.ekb.eg/article_13384.html
- Taouli B, Koh D. Diffusion-weighted MR imaging of the liver. Radiology. 2010;254(1):47-66. Available from: https://doi.org/10.1148/radiol.09090021
- Parikh T, Drew SJ, Lee VS, Wong S, Hecht EM, Babb JS, Taouli B. Focal liver lesion detection and characterization with diffusion-weighted MR imaging: comparison with standard breath-hold T2-weighted imaging. Radiology. 2008;246(3):812-822. Available from: https://doi.org/10.1148/radiol.2463070432
- Qayyum A. Diffusion-weighted imaging in the abdomen and pelvis: concepts and applications. Radiographics. 2009;29(6):1797-1810. Available from: https://doi.org/10.1148/rg.296095521
- An HS, Park HS, Kim YJ, Jung SI, Jeon HJ. Focal nodular hyperplasia: characterization at gadoxetic acid-enhanced MRI and diffusion-weighted MRI. Br J Radiol. 2013;86(1028):20130299. Available from: https://doi.org/10.1259/bjr.20130299
- Ba-Ssalamah A, Baroud S, Bastati N, Qayyum A. MR imaging of benign focal liver lesions. Magn Reson Imaging Clin N Am. 2010;18(3):403-419. Available from: https://doi.org/10.1016/j.mric.2010.08.001
- Goshima S, Kanematsu M, Kondo H, Yokoyama R, Kajita K, Tsuge Y, et al. Diffusion-weighted imaging of the liver: optimizing b value for the detection and characterization of benign and malignant hepatic lesions. J Magn Reson Imaging. 2008;28:691-697. Available from: https://doi.org/10.1002/jmri.21467
- Sandrasegaran K, Akisik FM, Lin C, Tahir B, Rajan J, Aisen AM. The value of diffusion-weighted imaging in characterizing focal liver masses. Acad Radiol. 2009;16:1208-1214. Available from: https://doi.org/10.1016/j.acra.2009.05.013
- Abdulghaffar W, Nasr M, Shahin W, El-Tantawy AM, Akl TH. 3-T magnetic resonance diffusion-weighted imaging (DWI) for characterization of hepatic masses. OMICS J Radiol. 2017;6:249.
- Bruegel M, Holzapfel K, Gaa J, Woertler K, Waldt S, Kiefer B, et al. Characterization of focal liver lesions by ADC measurements using a respiratory-triggered diffusion-weighted single-shot echo-planar MR imaging technique. Eur Radiol. 2008;18:477-485. Available from: https://doi.org/10.1007/s00330-007-0785-9
- Gourtsoyianni S, Papanikolaou N, Yarmenitis S, Maris T, Karantanas A, Gourtsoyiannis N. Respiratory gated diffusion-weighted imaging of the liver: value of apparent diffusion coefficient measurements in the differentiation between most commonly encountered benign and malignant focal liver lesions. Eur Radiol. 2008;18(3):486-492. Available from: https://doi.org/10.1007/s00330-007-0798-4
- Kim T, Murakami T, Takahashi S, Hori M, Tsuda K, Nakamura H. Diffusion-weighted single-shot echoplanar MR imaging for liver disease. AJR Am J Roentgenol. 1999;173(2):393-398. Available from: https://doi.org/10.2214/ajr.173.2.10430143
- Namimoto T, Yamashita Y, Sumi S, Tang Y, Takahashi M. Focal liver masses: characterization with diffusion-weighted echo-planar MR imaging. Radiology. 1997;204:739-744. Available from: https://doi.org/10.1148/radiology.204.3.9280252
- Sun XJ, Quan XY, Huang FH, Xu YK. Quantitative evaluation of diffusion-weighted magnetic resonance imaging of focal hepatic lesions. World J Gastroenterol. 2005;11(41):6535. Available from: https://doi.org/10.3748/wjg.v11.i41.6535
- Moteki T, Horikoshi H, Oya N, Aoki J, Endo K. Evaluation of hepatic lesions and hepatic parenchyma using diffusion-weighted reordered turbo FLASH magnetic resonance images. J Magn Reson Imaging. 2002;15:564-572. Available from: https://doi.org/10.1002/jmri.10101