
More Information
Submitted: October 30, 2026 | Accepted: November 07, 2026 | Published: November 09, 2026
Citation: Valenzuela RF, Duran-Sierra E, Hwang KP, Antony M, Espinoza-Figueroa J, Askari A, et al. ZTE vs. CT Quantitative Similarities: Volumetric, First- and Higher-order Radiomics Comparisons between Zero-echo-time MRI and Conventional CT for Evaluating Metastatic Bone Lesions and Healthy Bone. J Radiol Oncol. 2026; 10(3): 42-49. Available from:
https://dx.doi.org/10.29328/journal.jro.1001091
DOI: 10.29328/journal.jro.1001091
Copyright license: © 2026 Valenzuela RF, et al. This is an open access article distributed under the Creative Commons Attribution License, which permits unrestricted use, distribution, and reproduction in any medium, provided the original work is properly cited.
Keywords: Zero-echo-time (ZTE); Computed tomography (CT)

ZTE vs. CT Quantitative Similarities: Volumetric, First- and Higher-order Radiomics Comparisons between Zero-echo-time MRI and Conventional CT for Evaluating Metastatic Bone Lesions and Healthy Bone
Raul F Valenzuela1*, Elvis Duran-Sierra1, Ken-Pin Hwang2, Mathew Antony1, Jossue Espinoza-Figueroa1, Ali Askari1, Sam Lo1, John E Madewell1, William A Murphy1, R Jason Stafford1, Behrang Amini1, Maggie Fung3, Colleen Costelloe1, Christine Tang4, Pia V Valenzuela5, Corinne Lo1, Meera Raghavan1, Benjamin Hines1 and Xinzeng Wang2
1Department of Musculoskeletal Imaging, MD Anderson Cancer Center, Houston, Texas, USA
2Department of Medical Physics, MD Anderson Cancer Center, Houston, Texas, USA
3GE HealthCare, New York, USA
4Department of Radiology, Baylor College of Medicine, Houston, Texas, USA
5McGovern Medical School at UTHealth Houston, Texas, USA
*Corresponding author: Raul F Valenzuela, Department of Musculoskeletal Imaging, MD Anderson Cancer Center, Houston, Texas, USA, Email: [email protected]
Background: Zero-Echo-Time (ZTE) MRI is an advanced imaging technique designed to capture tissues with very short transverse relaxation times—such as short-T2 materials—that quickly lose signal after excitation and are often invisible to conventional MRI. ZTE enhances bone contrast, generating images that closely approximate those of computed tomography (CT) using ray-sum rendering and inverse-logarithm rescaling. Despite promising visual similarities, previous perception-based radiological observations have lacked quantitative validation. Our group previously demonstrated that oZTEo, GE Healthcare’s implementation of ZTE MRI, provides a clinically viable alternative to conventional CT for evaluating healthy bone. In this study, we aim to quantitatively compare oZTEo and CT in assessing various metastatic bone lesions and healthy bone.
Methods: Starting in July 2025, we integrated oZTEo into our institution’s routine musculoskeletal pelvic MRI protocols, using nine GE MRI scanners (two 3 Tesla and seven 1.5 Tesla). This prospective study included two cohorts: the metastatic arm enrolled 40 patients who underwent both CT and oZTEo scans for pelvic metastases within six months, while the healthy bone arm included 40 patients with matched inclusion criteria, for a total of 80 participants. We completed manual volume-of-interest (VOI) segmentations using MIM software: healthy hips in the healthy bone arm and metastatic lesions in the metastatic arm, for both oZTEo and CT. VOI histogram analysis was performed to assess intensity distributions between oZTEo and CT, with histograms from both modalities normalized using z-score standardization. First-order and higher-order radiomic features were then computed and compared between oZTEo and CT using two one-sided paired tests for equivalence.
Results: 20 (50%) lesions were sclerotic, 15 (38%) lytic, and 5 (12%) mixed.
Sclerotic lesions: In oZTEo vs. CT, volume was 8% lower for sclerotic lesion VOIs (p = 0.0, statistically equivalent). Delta Radiomics: 96% of features were statistically equivalent (p < 0.00047). The most dissimilar radiomic features were GLSZM large-area-low-gray-level-emphasis (p = 0.0009), GLSZM zone-variance (p = 0.0007), and GLSZM large-area-emphasis (p = 0.0007). Normalized intensity histograms showed a 93% overlap.
Lytic lesions: In oZTEo vs. CT, volume was 21% higher for lytic lesion VOIs (p = 0.0069, statistically equivalent). Delta radiomics: 66% of radiomic features were statistically equivalent (p < 0.00047). The most dissimilar features were NGTDM complexity (p = 0.0052), GLZM gray-level-non-uniformity-normalized (p = 0.0026), and first-order 90th percentile (p = 0.0025). Normalized intensity histograms showed a 78% overlap.
Mixed lesions: In oZTEo vs. CT, volume was 7% lower for mixed lesion VOIs (p = 0.001, statistically equivalent). Delta Radiomics: 32% of features were statistically equivalent (p < 0.00047). The most dissimilar features included GLSZM small-area-high-gray-level-emphasis (p = 0.113), GLDM dependence-entropy (p = 0.1012), and GLRLM long-run-high-gray-level-emphasis (p = 0.0815). Normalized intensity histograms showed 95% overlap.
Healthy marrow: oZTEo VOI volume was 8% lower than in CT (p = 0.031, statistically equivalent). Delta Radiomics: 100% of radiomic features were statistically equivalent (p < 0.00047). Normalized intensity histograms showed 94% overlap.
Conclusion: This study provides objective evidence that oZTEo and CT have similar intensity distributions and comparable radiomic features, offering quantitative validation beyond visual assessment. These findings support oZTEo as a clinically viable MRI alternative to conventional CT for evaluating both healthy bone and metastatic bone lesions.
In musculoskeletal radiology, ZTE-MR offers excellent differentiation between cortical bone and soft tissue, comparable to radiography and CT [1,2]. Its utility spans a wide variety of developmental, traumatic, inflammatory, rheumatologic, and oncologic conditions [1,2]. For developmental disorders, ZTE-MR facilitates morphometric analyses such as the Insall-Salvati ratio for patellar height, tibial tuberosity–trochlear groove distance, lower-extremity rotation profile, critical shoulder angle, and femoro-acetabular impingement morphology [1]. In trauma cases, ZTE-MR enhances the visualization of fractures—especially stress fractures that are often missed by conventional MRI or radiography [1]. Additionally, it enables detection of osteolytic changes in the distal clavicle resulting from post-traumatic injury or repetitive overuse [1]. ZTE-MR allows detailed evaluation of osseous lesions, including cortical integrity, lesion margins, bone expansion, erosions, intralesional bone fragments, and hyperostosis in the skull and calvarium [3].
Previous studies have shown ZTE-MR to be effective for assessing fractures of the skull base, calvarium, and facial bones [4-6]. In inflammatory and rheumatologic disorders, ZTE-MR reliably detects osseous abnormalities such as erosions, sclerosis, and sacroiliac joint-space alterations in children with enthesitis-related arthritis (ERA) and in adults evaluated for sacroiliitis [7-9]. In degenerative joint disease, ZTE-MR accurately measures hip joint-space narrowing and improves visualization of osteophytes, subchondral sclerosis, and retained foreign bodies within the joint space [1,10].
In musculoskeletal oncology, both ZTE-MR and gradient-echo black bone (BB) imaging exhibit high diagnostic accuracy for detecting lytic lesions in the spine, pelvis, and femur of patients with multiple myeloma, using CT as the reference standard [11]. While both methods perform well, ZTE-MR has produced more false-negative findings in spinal lesions [11]. Notably, ZTE-MR can depict cortical disruption in atypical cartilaginous lesions and characterize both lytic and sclerotic tumor components, as well as areas of bone formation [1].
ZTE-MR can serve as an alternative to CT, simplifying the diagnostic workflow while eliminating the radiation exposure associated with CT imaging [12-14]. ZTE-MR may provide substantial clinical value in the diagnosis and long-term surveillance of patients with bone tumors or tumor-like lesions [12].
Although evidence for using ZTE-MR to evaluate bone metastases is scarce, Xu, et al. compared ZTE-MR with CT in a cohort of 36 patients with primary bone tumors and metastases. The study found no statistically significant differences between ZTE-MR and CT in the radiological-perceptual assessment of bone destruction, lesion margins, periosteal reaction, sclerosis, calcifications, or soft tissue involvement [12]. These findings suggest that ZTE-MR imaging may serve as a viable alternative to CT. ZTE-MR may offer substantial clinical value in both the diagnosis and long-term surveillance of patients with bone tumors or tumor-like lesions. Nevertheless, to our knowledge, no prior quantitative analyses have yet validated these perception-based radiological findings.
Study objective: We aim to provide quantitative evidence for the established subjective visual similarities between oZTEo and CT across different types of metastatic bone lesions, using radiomics and histogram analysis.
As a secondary objective, we aim to further quantitatively validate oZTEo and CT similarities previously reported by our group [15] in healthy bone marrow.
Patient population: Since July 2025, oZTEo has been used in routine musculoskeletal pelvic MRI protocols at our institution. This prospective study included 40 patients who underwent oZTEo and CT screening for bone metastases with a time interval of less than six months between MR and CT scans. We categorized lesions by CT appearance as sclerotic (n < 20), lytic (n < 15), or mixed (n < 5). An additional 40 patients underwent right hip segmentation to compare normal bone and bone marrow analysis on CT vs. oZTEo. In total, the metastatic arm and the healthy bone and bone marrow arm totaled 80 patients.
Image processing and feature extraction: Clinical oZTEo MRI and CT images were acquired using nine GEHC MRI scanners (two at 3 Tesla and seven at 1.5 Tesla) and transferred to the institutional Picture Archiving and Communication System (PACS, IntelliSpace Philips). Using MIM version 7.3.7 (MIM Software Inc., GE HealthCare), we retrieved images from PACS and created manual volume-of-interest (VOI) 3D segmentations for both arms of the study: 1) metastatic arm, including metastatic bone lesions on both oZTEo and CT, and 2) healthy bone arm:, including VOI segmentations performed on healthy right hips, or on the left if the right was affected by pathology or hardware. We focused on achieving near-exact VOIs from CT and oZTEo, with quality assessed based on volume measurements obtained from MIM followed by statistical analysis based on two one-sided paired tests (TOST) for equivalence. Two research assistants generated the VOIs under the supervision of an experienced musculoskeletal radiologist. We then exported the VOIs from MIM in DICOM RT-Struct format for radiomic feature extraction using an in-house-developed, Python-based, sequence-neutral cancer radiomic and perfusion imaging (CARPI) automated framework [16], implemented on a local workstation (Dell Inc; two Intel Xeon Gold 5222 processors @3.80 GHz; 32 GB RAM). Before feature extraction, the oZTEo and CT VOI intensity distributions were independently normalized using z-score standardization (Equation 1).
, (1)
where x represents the original intensity value, while µ and σ represent the mean and standard deviation of the intensity distribution, respectively. This process normalized each VOI intensity distribution to zero mean and unit standard deviation [17]. After this process, CARPI automatically extracted 107 radiomic features from each VOI using Pyradiomics 3.0.1, including 14 shape, 18 first-order, and 75 texture features [16].
Lesion volume analysis: Volume measurements were computed from oZTEo and CT VOIs for each of the 40 lesions on the metastatic arm and 40 right hips on the healthy bone arm, using MIM version 7.3.7. We performed paired statistical analyses TOST for equivalence comparing oZTEo vs. CT in sclerotic, lytic, and mixed lesions, and healthy bone marrow. Pre-specified TOST volume bounds were set at ±5 mL and ±15 mL for metastatic lesions and healthy bone, respectively. Statistical significance was assessed at 5% (p < 0.05).
Intensity histogram analysis
For the metastatic arm, for each lesion type, the aggregated oZTEo and CT VOI intensity histograms were generated before and after z-score standardization. We computed and compared absolute differences in mean, skewness, kurtosis, and the 10th and 90th percentiles between the oZTEo and CT aggregated histograms across sclerotic, lytic, and mixed lesions.
Normal bone arm: The same algorithm was performed for the healthy bone arm, comparing CT vs. oZTEo.
Statistical analysis of radiomic features: We compared 107 standardized radiomic features between oZTEo and CT for sclerotic, lytic, and mixed lesions using paired TOST for equivalence. Standardized TOST bounds were set at ±1.2 standard deviations, and a Bonferroni-corrected [18] significance level of p = 0.00047 was used for all tests. The means and 90% confidence intervals of absolute differences of radiomic features in oZTEo vs. CT were computed for each lesion type. A similar analysis was performed for CT vs. oZTEo in the healthy bone arm. All statistical analyses were performed in Python (version 3.10.13) using Pingouin (version 0.6.1) and Scikit-Learn (version 1.4.1).
Patient population
In the metastatic arm, 20 (50%) patients were male, and 20 (50%) were female. The average patient age was 59 years (range: 16-76 years). The average time between oZTEo and CT scans was 0.6 months (range: zero days to 5 months). The most common primary cancer origins of sclerotic lesions were the lungs (35%), followed by the prostate (25%). For lytic lesions, the most common primary cancer origins were the thyroid (33%), followed by the kidney/liver (13%). Mixed lesion primary cancer origins included breast, biliary duct, thyroid, kidney, and sacral chordoma. Representative examples of CT and oZTEo images of sclerotic, lytic, and mixed lesions are shown in Figures 1-3.
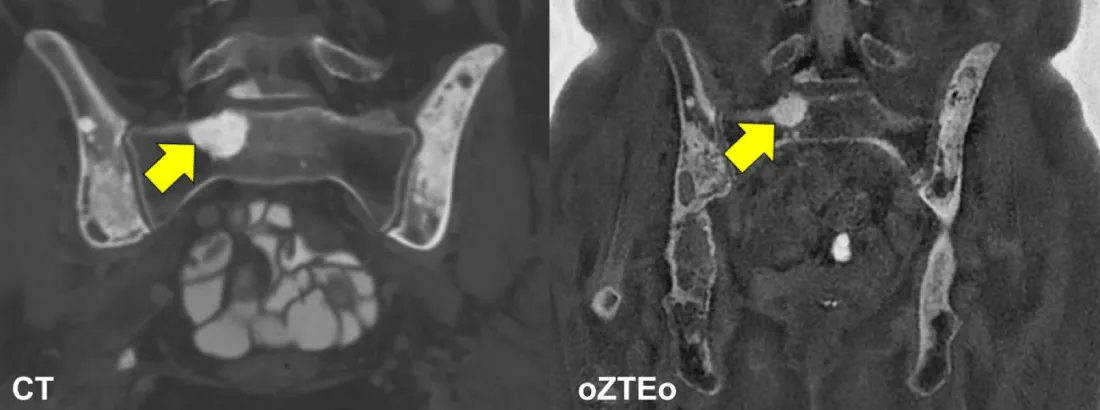
Figure 1: Representative sclerotic lesion: CT (left) and oZTEo (right) images of a 61-year-old female with metastatic lung adenocarcinoma. Coronal pelvis CT and coronal pelvis oZTEo demonstrate multifocal sclerotic osseous metastases involving the lower lumbar spine, both innominate bones, and the right sacral ala at the S1 level (yellow arrows).
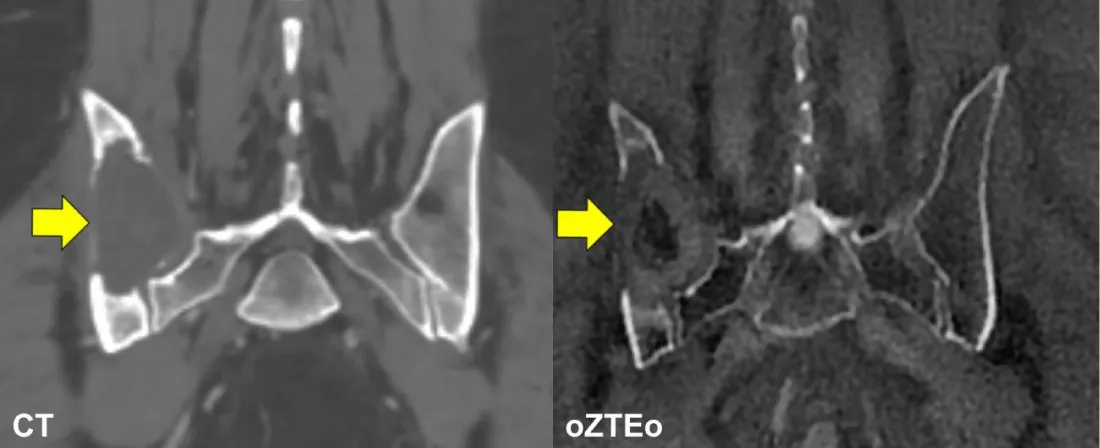
Figure 2: Representative lytic lesion: CT (left) and oZTEo (right) images of a 57-year-old male with metastatic renal cell carcinoma. Coronal pelvis CT and coronal pelvis oZTEo reveal a destructive lytic metastatic lesion in the right ilium, with mild osseous expansion (yellow arrows).
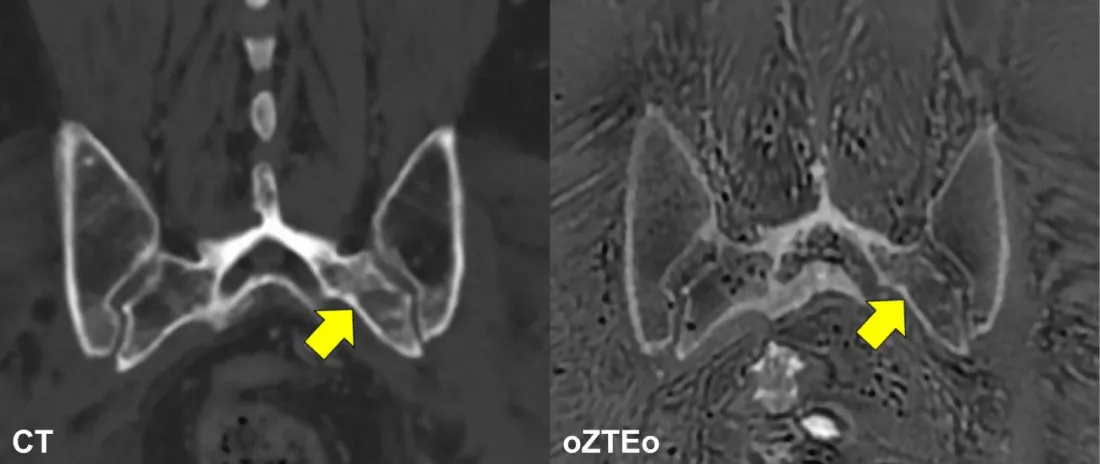
Figure 3: Representative mixed lesion: CT (left) and oZTEo (right) images of a 74-year-old male with metastatic sacral chordoma. Coronal pelvis CT and coronal pelvis oZTEo demonstrate a heterogeneous mixed lytic-sclerotic lesion involving the posterior left iliac bone and the left sacral ala at the S1-S2 levels (yellow arrows).
In the normal bone arm: 18 (45%) patients were male, and 22 (55%) were female. The average patient age was 52 years (range: 23-90 years). The average time between oZTEo and CT scans was 1.5 months (range: zero days to 6.5 months).
Metastatic Arm
Volume analysis: Figure 4 summarizes the statistical comparison of volume measurements between oZTEo and CT for sclerotic, lytic, and mixed lesions. On average, oZTEo VOI segmentations showed 8% lower volume for sclerotic lesions (p = 0.0), 21% higher volume for lytic lesions (p = 0.0069), and 7% lower volume for mixed lesions (p = 0.001) compared with CT VOI segmentations. The VOI volume comparisons across the three lesion types were statistically equivalent (P < 0.05), indicating good agreement between oZTEo and CT segmentations.
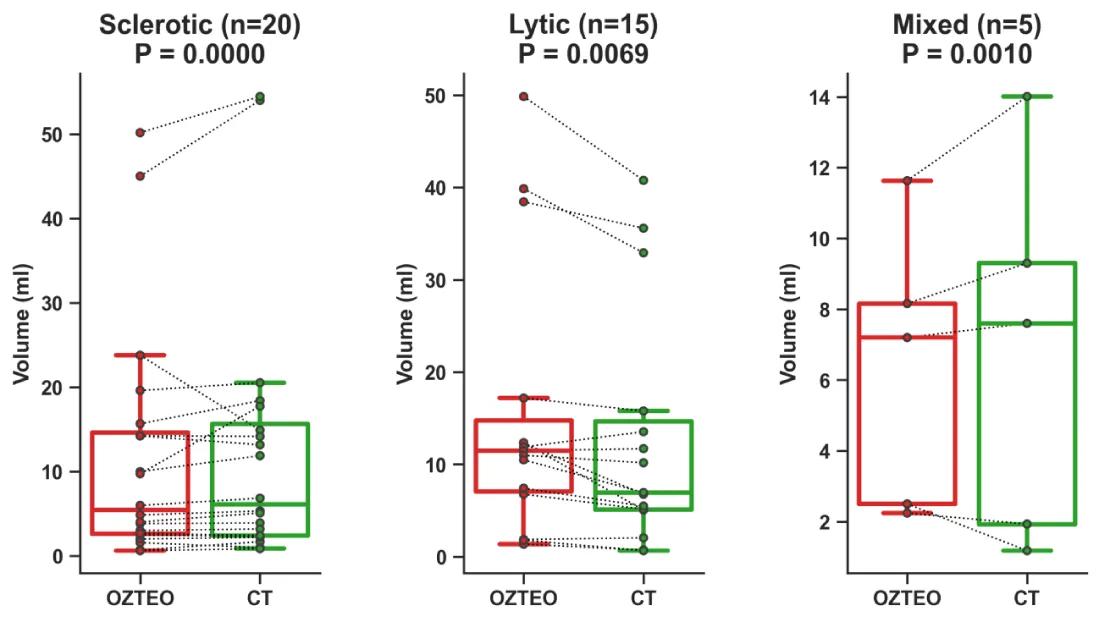
Figure 4: Boxplots of volume measurements from sclerotic, lytic, and mixed lesions comparing oZTEo vs. CT. The average volume differences in sclerotic, lytic, and mixed lesions were 8% (p = 0.0), 21% (p = 0.0069), and 7% (p = 0.001), respectively, and all of them were statistically equivalent.
Intensity histogram analysis/first-order radiomics-metastatic arm: Table 1 summarizes the first-order radiomics extracted from the oZTEo and CT raw and standardized aggregated intensity histograms of sclerotic, lytic, and mixed lesions.
| Table 1: Summary of first-order radiomics extracted from the oZTEo and CT raw and standardized aggregated intensity histograms of sclerotic, lytic, and mixed lesions. | |||||||
| Raw Aggregated Histogram | Standardized Aggregated Histogram | ||||||
| oZTEo (a.u.) | CT (a.u.) | Absolute Delta (a.u.) | oZTEo (s.v.) | CT (s.v.) | Absolute Delta (s.v.) | ||
| Sclerotic Lesions (n=20) |
Mean | 1,200 | 694 | 506 | 0 | 0 | 0 |
| Skewness | 3.41 | 0.11 | 3.297 | -0.02 | -0.23 | 0.21 | |
| Kurtosis | 13.47 | -0.81 | 14.283 | -0.025 | -0.239 | 0.214 | |
| 10th Percentile | 756 | 215 | 541 | -1.251 | -1.316 | 0.065 | |
| 90th Percentile | 1,669 | 1,185 | 484 | 1.288 | 1.21 | 0.078 | |
| Lytic Lesions (n=15) |
Mean | 1,718 | 192 | 1,526 | 0 | 0 | 0 |
| Skewness | 1.03 | 1.6 | 0.573 | 0.698 | 1.357 | 0.659 | |
| Kurtosis | 0.82 | 2.35 | 1.534 | 0.804 | 1.288 | 0.484 | |
| 10th Percentile | 732 | 27 | 705 | -1.101 | -0.87 | 0.231 | |
| 90th Percentile | 3,011 | 474 | 2,537 | 1.35 | 1.559 | 0.209 | |
| Mixed Lesions (n=5) |
Mean | 1,156 | 375 | 781 | 0 | 0 | 0 |
| Skewness | 1.47 | 0.89 | 0.578 | 0.451 | 0.642 | 0.191 | |
| Kurtosis | 1.14 | -0.2 | 1.337 | 0.184 | 0.001 | 0.183 | |
| 10th Percentile | 587 | 57 | 530 | -1.125 | -1.117 | 0.008 | |
| 90th Percentile | 2,297 | 875 | 1,422 | 1.414 | 1.465 | 0.051 | |
Sclerotic lesions: Figure 5 presents the aggregated intensity histograms of oZTEo and CT for sclerotic lesions (n=20) before and after z-score standardization. Before standardization (raw histograms), the absolute differences in arbitrary units (a.u.) between oZTEo and CT for the histogram mean, skewness, kurtosis, 10th and 90th percentiles were 506 a.u., 3.3 a.u., 14.3 a.u., 541 a.u., and 484 a.u., respectively. Histogram area overlap was limited to 53%. After standardization, z-score differences in standardized values (s.v.) were reduced to 0 s.v., 0.2 s.v., 0.21 s.v., 0.07 s.v., and 0.08 s.v., respectively. Histogram area overlap increased to 93%.
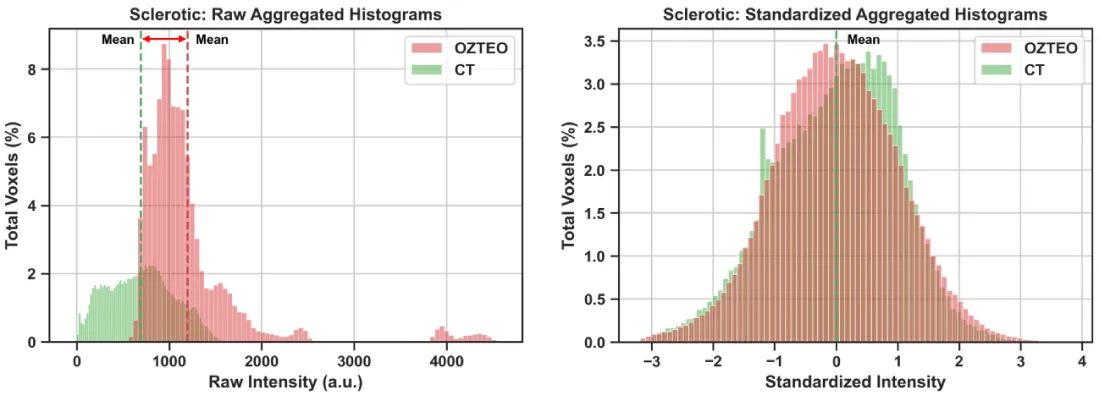
Figure 5: Sclerotic lesions: Aggregated oZTEo and CT intensity histograms from 20 sclerotic lesions before (left panel) and after (right panel) z-score standardization. The raw histograms displayed minimal area overlap (53%), while the standardized histograms were aligned at the mean and displayed higher area overlap (93%)
Lytic lesions: Figure 6 presents the aggregated intensity histograms of oZTEo and CT for lytic lesions (n < 15) before and after z-score standardization. Before standardization (raw histograms), the absolute differences between oZTEo and CT for the histogram mean, skewness, kurtosis, 10th and 90th percentiles were 1,526 a.u., 0.57 a.u., 1.53 a.u., 705 a.u., and 2,537 a.u., respectively. Histogram area overlap was limited to 11%. After standardization, z-score differences were reduced to 0 s.v., 0.66 s.v., 0.48 s.v., 0.23 s.v., and 0.21 s.v., respectively. Histogram area overlap increased to 78%.
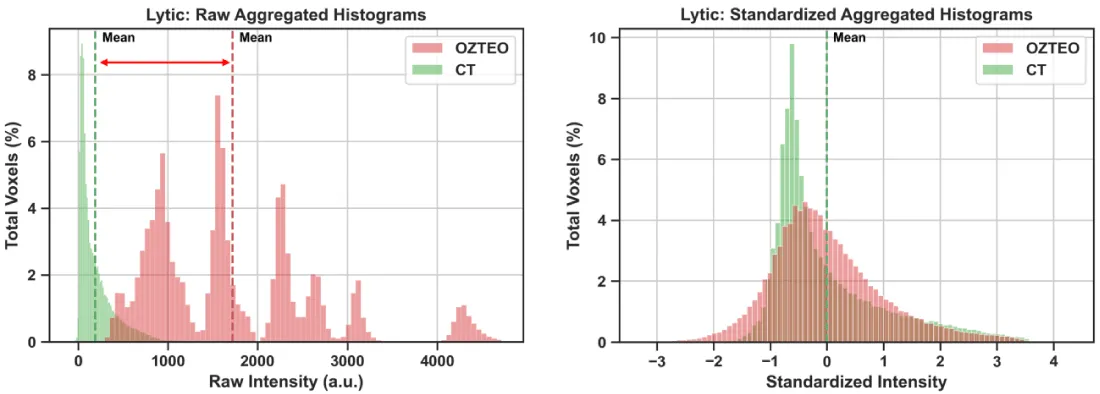
Figure 6: Lytic lesions: Aggregated oZTEo and CT intensity histograms from 15 lytic lesions before (left panel) and after (right panel) z-score standardization. The raw histograms displayed minimal area overlap (11%), while the standardized histograms were aligned at the mean and displayed higher area overlap (78%).
Mixed lesions: Figure 7 presents the aggregated intensity histograms of oZTEo and CT for mixed lesions (n < 5) before and after z-score standardization. Before standardization (raw histograms), the absolute differences between oZTEo and CT for the histogram mean, skewness, kurtosis, 10th and 90th percentiles were 781 a.u., 0.58 a.u., 1.34 a.u., 530 a.u., and 1,422 a.u., respectively. Histogram area overlap was limited to 26%. After standardization, z-score differences were reduced to 0 s.v., 0.19 s.v., 0.18 s.v., 0.008 s.v., and 0.05 s.v., respectively. Histogram area overlap increased to 95%.
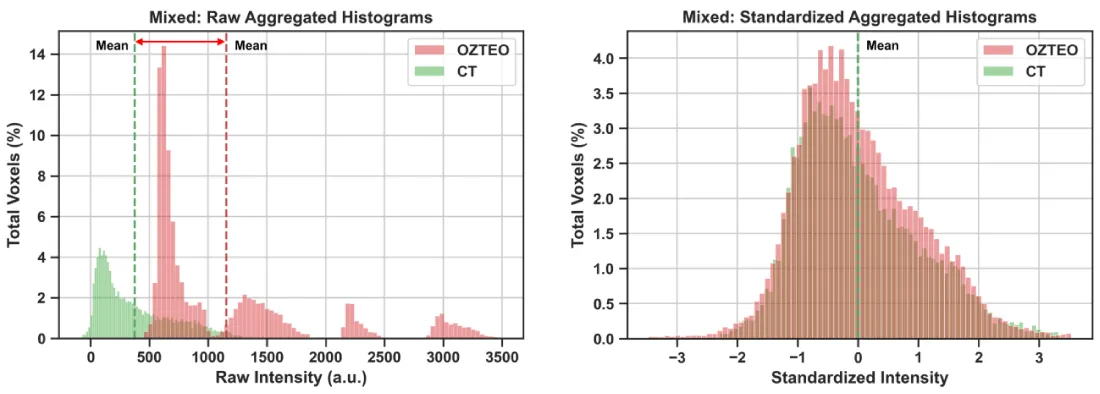
Figure 7: Mixed lesions: Aggregated oZTEo and CT intensity histograms from five mixed lesions before (left panel) and after (right panel) z-score standardization. The raw histograms displayed minimal area overlap (26%), while the standardized histograms were aligned at the mean and displayed higher area overlap (95%).
Combined first- and high-order radiomic analysis: Figure 8 summarizes the means with 90% confidence intervals of absolute differences for 107 standardized radiomic features comparing oZTEo vs. CT in sclerotic lytic, and mixed lesions.
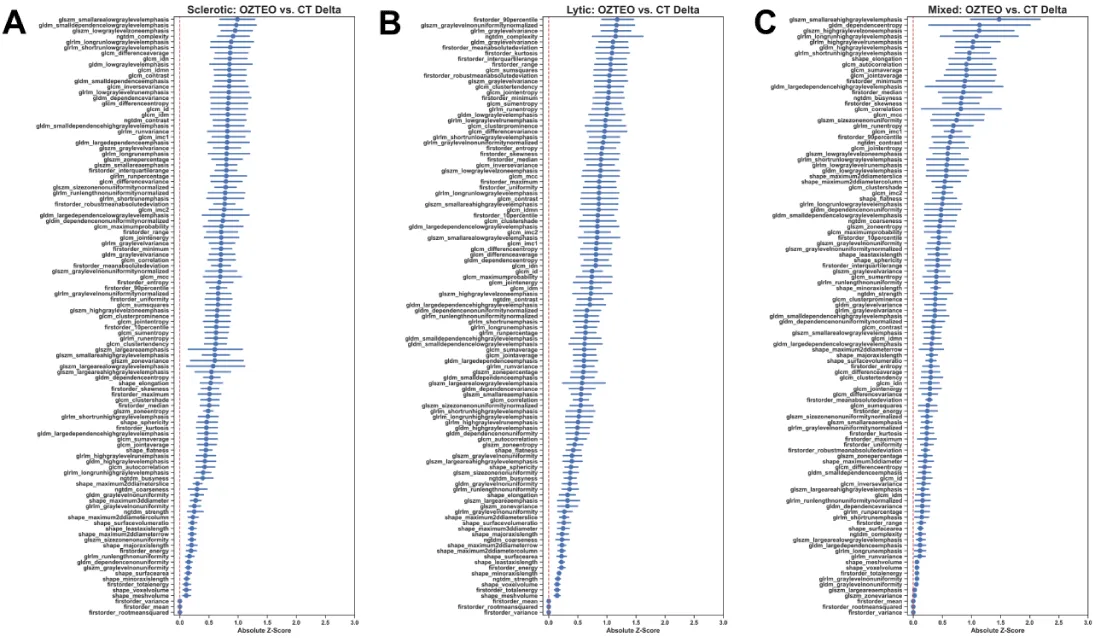
Figure 8: Means with 90% confidence intervals of absolute differences in oZTEo vs. CT standardized radiomics of (A) sclerotic, (B) lytic, and (C) mixed lesions ordered by mean difference. Sclerotic lesions: Most features displayed confidence intervals below one absolute standard deviation and 96% of them were statistically equivalent (p < 0.00047). Lytic lesions: Most features displayed confidence intervals below 1.5 absolute standard deviations and 66% of them were statistically equivalent (p < 0.00047). Mixed lesions: Most features displayed confidence intervals below 2 absolute standard deviations and only 32% of them were statistically equivalent (p < 0.00047).
Sclerotic lesions: The statistical power to detect a medium effect size (Cohen’s d = 0.5) with a two-tailed paired t - test, 20 samples, and an adjusted significance level of p = 0.00047 was 6%. 103/107 (96%) features were statistically equivalent (p < 0.00047) in oZTEo vs. CT (Figure 8A). The top three not statistically equivalent features included GLSZM large-area-low-gray-level-emphasis (p = 0.0009), GLSZM zone-variance (p = 0.0007), and GLSZM large-area-emphasis (p = 0.0007).
Lytic lesions: The statistical power to detect a medium effect size (Cohen’s d = 0.5) of a two-tailed paired t - test with 15 samples and adjusted significance level of p = 0.00047 was 3%. 71/107 (66%) features were statistically equivalent (p < 0.00047) in oZTEo vs. CT (Figure 8B). The top three not statistically equivalent features included NGTDM complexity (p = 0.0052), GLZM gray-level-non-uniformity-normalized (p = 0.0026), and first-order 90th percentile (p = 0.0025).
Mixed lesions: The statistical power to detect a medium effect size (Cohen’s d=0.5) of a two-tailed paired t-test with 5 samples and an adjusted significance level of p = 0.00047 was 0.2%. 34/107 (32%) features were statistically equivalent (p < 0.00047) in oZTEo vs. CT (Figure 8C). The top three not statistically equivalent features included GLSZM small-area-high-gray-level-emphasis (p = 0.113), GLDM dependence-entropy (p = 0.1012), and GLRLM long-run-high-gray-level-emphasis (p = 0.0815).
Healthy bone marrow arm
Volume analysis: Figure 9 summarizes the statistical comparison of volume measurements between oZTEo and CT for 40 healthy bone marrow patients. The average volume difference between oZTEo and CT VOIs was only 8%, and the paired measurements were statistically equivalent (p = 0.031).
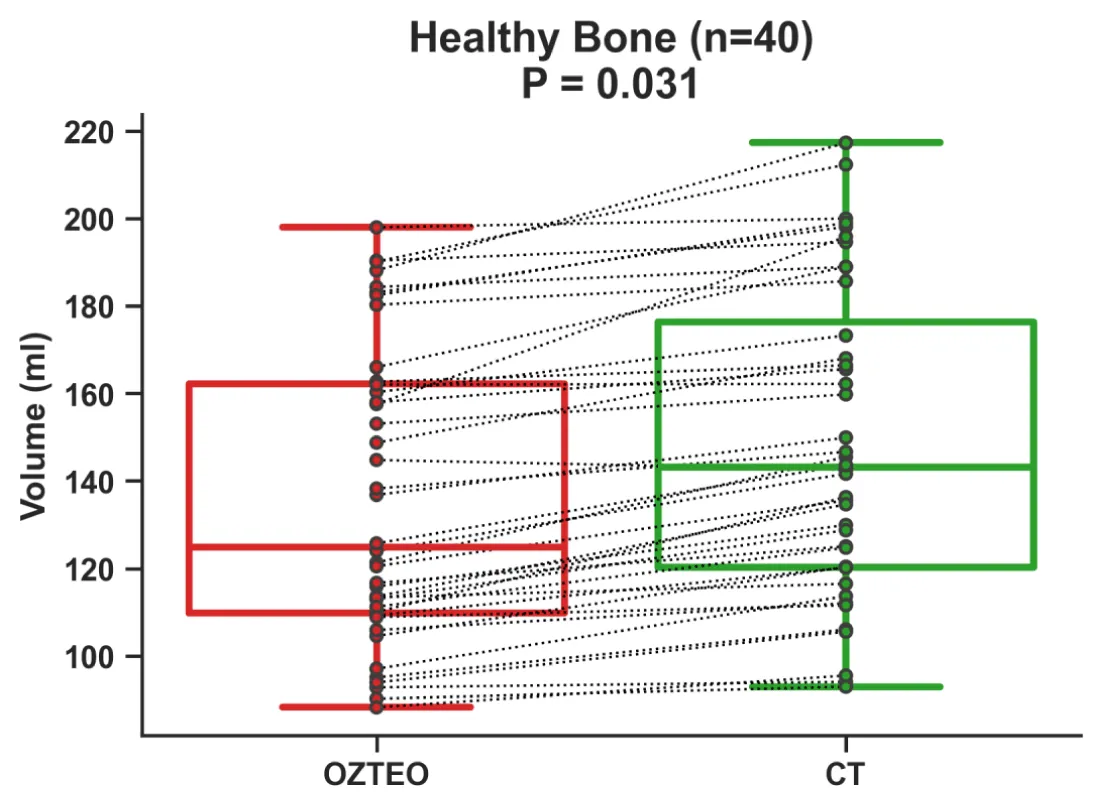
Figure 9: Boxplots of volume measurements from 40 healthy bone marrow samples comparing oZTEo vs. CT. The average volume difference between oZTEo and CT was only 8%, and the measurements were statistically equivalent (p = 0.031).
Intensity histogram/First-order radiomic analysis: Figure 10 shows the aggregated intensity histograms of oZTEo and CT for healthy bone marrow (n=40) before and after z-score standardization. Before standardization (raw histograms), the absolute differences between oZTEo and CT for the histogram mean, skewness, kurtosis, 10th and 90th percentiles were 1,350 a.u., 0.44 a.u., 2.8 a.u., 530 a.u., and 2,655 a.u., respectively. Histogram area overlap was limited to 24%. After standardization, z-score differences were reduced to 0 s.v., 0.16 s.v., 0.6 s.v., 0.01 s.v., and 0.1 s.v., respectively. Histogram area overlap increased to 94%.
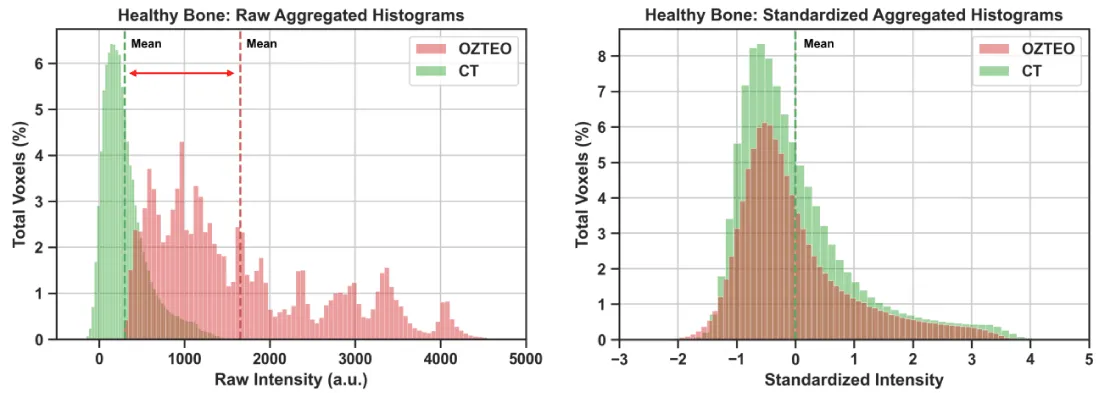
Figure 10: Aggregated oZTEo and CT intensity histograms from 40 healthy bone marrow samples before (left panel) and after (right panel) z-score standardization. The raw histograms displayed minimal area overlap (24%), while the standardized histograms were aligned at the mean and displayed higher area overlap (94%).
Combined first- and high-order radiomic analysis: The statistical power to detect a medium effect size (Cohen’s d = 0.5) with a two-tailed paired t - test, 40 samples, and an adjusted significance level of p = 0.00047 was 28%. Figure 11 summarizes the absolute differences for 107 standardized radiomic features comparing oZTEo vs. CT in healthy bone marrow. 100% of radiomic features were statistically equivalent (p < 0.00047) based on the paired TOST.
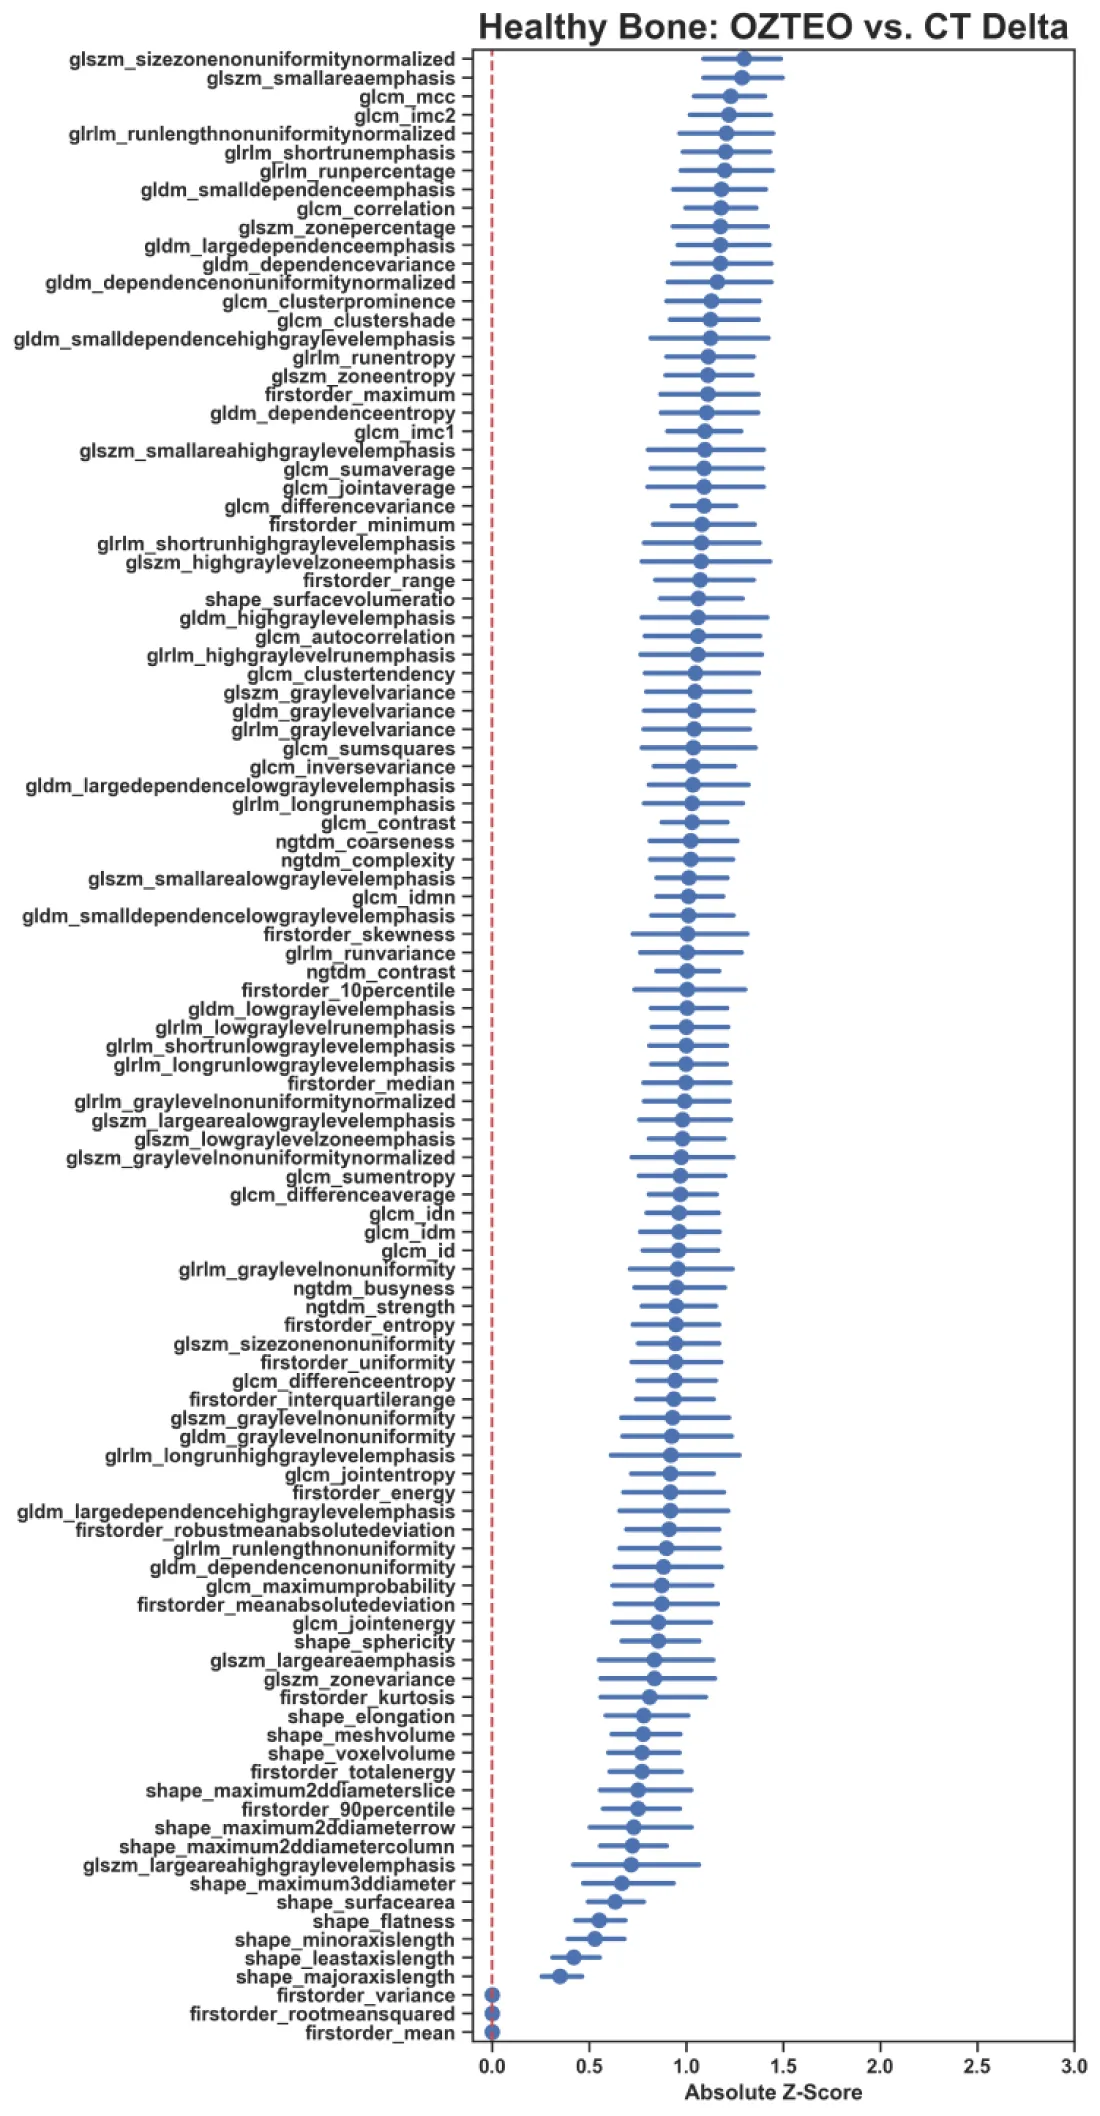
Figure 11: Means with 90% confidence intervals of absolute differences in oZTEo vs. CT standardized radiomics of 40 healthy bone marrow patients, ordered by mean difference. Most features displayed confidence intervals within one absolute standard deviation, and 100% of them were statistically equivalent (p < 0.00047) between oZTEo and CT.
This prospective study, including 40 patients with metastatic bone disease and 40 cases of healthy bone marrow, moves beyond subjective perceptual analyses to provide objective, quantitative evidence demonstrating that oZTEo and CT images are mathematically equivalent and offer comparable information for assessing metastatic bone lesions. Volumetric measurements, intensity histogram analysis, and radiomic features consistently support this similarity.
Volumetric analysis: minimal differences between oZTEo and CT volumetric measurements for sclerotic, lytic, mixed lesions, and healthy bone marrow displayed statistical equivalence, underscoring high geometric agreement of manually segmented VOIs in both modalities regardless of the type of tissue being segmented. We noted that lytic lesions showed the largest average volume difference, reflecting greater segmentation variability in these cases. This might be due to the poor edge demarcation of lytic lesions, which complicates tumor segmentation in both imaging techniques, particularly on oZTEo. Nevertheless, these findings represent further evidence that oZTEo provides very similar bone and tissue contrast to CT, enabling accurate segmentation of the anatomical volumes of interest.
Intensity histogram standardization: Z-score standardization of intensity distributions demonstrated to be critical for aligning and analyzing the histograms of oZTEo and CT images on the same scale (standard deviations from the mean), which were originally positioned at different intensity scales (MRI arbitrary units and CT Hounsfield units). This normalization strategy successfully removed modality-specific scale differences while preserving the original distribution shape, yielding comparable histograms with substantial area overlap. We noted minimal absolute first-order radiomic differences from histograms in sclerotic and mixed lesions, while lytic lesions showed greater variability. We suggest that, in contrast-enhanced CT, lytic lesions show greater variability because inconsistent contrast patterns are detected only on CT, increasing variability in the CT arm. In contrast, oZTEo is less affected by T1-shortening effects on MRI. Therefore, these results indicate that oZTEo imaging is highly reliable for sclerotic and mixed lesions, but first-order quantitative differences for lytic lesions may stem from contrast-enhancement-related signal variability on contrast-enhanced CT, complicating direct comparisons.
Delta radiomics analysis: Analysis of absolute differences across 107 standardized radiomic features between oZTEo and CT showed that most features were statistically equivalent in sclerotic lesions (96%), while only 66% of them were statistically equivalent in lytic lesions and 32% in mixed lesions. These findings indicate that oZTEo is highly reliable for assessing sclerotic lesions but has substantial limitations for evaluating lytic and mixed lesions. The low statistical power, given the sample sizes for lytic (n < 15, power = 3%) and mixed lesions (n < 5, power = 0.2%), and the large variability in their radiomic confidence intervals, may explain the smaller number of statistically equivalent features between modalities. In the healthy bone arm, 100% of radiomic features were statistically equivalent, indicating complete quantitative agreement between modalities and underscoring oZTEo as a clinically viable MRI alternative to conventional CT for healthy bone evaluation.
Study limitations: While the findings of this study are promising, their generalizability is constrained by the following limitations: 1) large differences (up to 6.5 months) in time between CT and oZTEo scans might introduce bias in the volumetric and radiomics comparisons, particularly in metastatic lesions affected by disease progression or treatment; 2) relatively small sample sizes of metastatic bone lesions; specifically, the very low statistical power (0.2%) achieved for the analysis of mixed lesions due to the limited number of cases (n < 5). To overcome these limitations, a future prospective study with larger, more balanced patient cohorts and closer timing between CT and oZTEo scans is needed to further validate these results. Nevertheless, our findings provide additional quantitative evidence of the underlying subjective visual similarities between oZTEo and CT in a clinical setting.
Overall, our results suggest that oZTEo is a highly reliable CT alternative for volume, first-order, and high-order radiomics feature measurements in healthy bone and metastatic disease, particularly on sclerotic bone lesions. However, its clinical utility for lytic and mixed lesions appears more limited, likely due to a very low number of cases analyzed. Our study provides quantitative evidence that oZTEo and CT display objective similarity beyond perceptual visual assessment, supporting oZTEo as a clinically viable MRI alternative to conventional CT for healthy bone and metastatic bone lesion evaluation.
Statements
Research ethics statement: Our study does not include animal or human experimentation and is not part of a clinical trial. All authors included have contributed to the current article. All data collection, management, and processing methods followed relevant guidelines and regulations, including institutional and generally accepted clinical, research, and ethical guidelines, as well as those governing data veracity and the protection of protected health information (PHI).
Data availability statement: The datasets used and analyzed during the current study are available from the corresponding author upon reasonable request.
Funding: Charitable funding sources of our research include the John S. Dunn, Sr. Distinguished Chair in Diagnostic Imaging and the M.R. Evelyn Hudson Foundation Endowed Professorship funds.
IRB and waiver of consent: Our Institutional Review Board waived the need to obtain informed consent and gave ethical and administrative approval to our research under the IRB identifier PA16-0857. Protocol Name: “Utility of imaging of bone and soft tissue tumors and disease and treatment-related changes for diagnosis, prognosis, treatment response, and outcome.”
Acknowledgment
The John S. Dunn, Sr. Distinguished Chair in Diagnostic Imaging.
M.R. Evelyn Hudson Foundation Endowed Professorship.
- Aydıngöz Ü, Yıldız AE, Ergen FB. Zero echo time musculoskeletal MRI: technique, optimization, applications, and pitfalls. Radiographics. 2022;42(5):1398-1414. Available from: https://dx.doi.org/https://doi.org/10.1148/rg.220029
- Fujisaki A, Tsukamoto J, Narimatsu H, Hayashida Y, Todoroki Y, Hirano N, et al. Zero echo time magnetic resonance imaging: techniques and clinical utility in musculoskeletal system. J Magn Reson Imaging. 2024;59(1):32-42. Available from: https://dx.doi.org/https://doi.org/10.1002/jmri.28843
- Tan T. Re: Utility of zero echo time (ZTE) sequence for assessing bony lesions of skull base and calvarium: Challenges and expanding the applications of ZTE MRI in paediatric radiology. Clin Radiol. 2025;84.
- Lu A, Gorny K, Ho ML. Zero TE MRI for craniofacial bone imaging. AJNR Am J Neuroradiol. 2019;40(9):1562-1566. Available from: https://dx.doi.org/https://doi.org/10.3174/ajnr.a6175
- Cho SB, Baek HJ, Ryu KH, Choi BH, Moon JI, Kim TB, et al. Clinical feasibility of zero TE skull MRI in patients with head trauma in comparison with CT: a single-center study. AJNR Am J Neuroradiol. 2019;40(1):109-115. Available from: https://dx.doi.org/https://doi.org/10.3174/ajnr.a5916
- Kralik SF, Supakul N, Wu IC, Delso G, Radhakrishnan R, Ho CY, et al. Black bone MRI with 3D reconstruction for the detection of skull fractures in children with suspected abusive head trauma. Neuroradiology. 2019;61(1):81-87. Available from: https://dx.doi.org/https://doi.org/10.1007/s00234-018-2127-9
- Li Y, Xiong Y, Hou B, Liu C, Wang J, Liu WV, et al. Comparison of zero echo time MRI with T1-weighted fast spin echo for the recognition of sacroiliac joint structural lesions using CT as the reference standard. Eur Radiol. 2022;32(6):3963-3973. Available from: https://dx.doi.org/https://doi.org/10.1007/s00330-021-08513-5
- Bayrak YE, Özer T, Anik Y, Balci S, Aydin D, Şahin N, et al. Assessment of sacroiliitis using zero echo time magnetic resonance imaging: a comprehensive evaluation. Pediatr Radiol. 2025;55(5):999-1005. Available from: https://dx.doi.org/https://doi.org/10.1007/s00247-025-06201-w
- Zhang Z, Wang J, Li Y, Liang C, Sui H, Huang Z, et al. Bone assessment of the sacroiliac joint in ankylosing spondylitis: comparison between computed tomography and zero echo time MRI. Eur J Radiol. 2024;181:111743. Available from: https://dx.doi.org/https://doi.org/10.1016/j.ejrad.2024.111743
- Hou B, Liu C, Li Y, Xiong Y, Wang J, Zhang P, et al. Evaluation of the degenerative lumbar osseous morphology using zero echo time magnetic resonance imaging (ZTE-MRI). Eur Spine J. 2022;31(3):792-800. Available from: https://dx.doi.org/https://doi.org/10.1007/s00586-021-07099-2
- Lecouvet FE, Zan D, Lepot D, Chabot C, Vekemans MC, Duchêne G, et al. MRI-based zero echo time and black bone pseudo-CT compared with whole-body CT to detect osteolytic lesions in multiple myeloma. Radiology. 2024;313(1):e231817. Available from: https://dx.doi.org/https://doi.org/10.1148/radiol.231817
- Xu Y, et al. Value of zero echo time MR imaging and CT in diagnosis of bone destructions of bone tumors and tumor-like lesions. Chin J Acad Radiol. 2020;3(2):108-114.
- Ferrari L, Bianchi T, Champendal M, Sá Dos Reis C, Ghotra SS. Ultra-short and zero echo time MRI sequences for MSK investigation: a scoping review. Radiography (Lond). 2026;32(3):103334. Available from: https://dx.doi.org/https://doi.org/10.1016/j.radi.2026.103334
- Sandberg JK, Young VA, Yuan J, Hargreaves BA, Wishah F, Vasanawala SS. Zero echo time pediatric musculoskeletal magnetic resonance imaging: initial experience. Pediatr Radiol. 2021;51(13):2549-2560. Available from: https://dx.doi.org/https://doi.org/10.1007/s00247-021-05125-5
- Valenzuela RF, Duran-Sierra E, Pin KH, Ma J, Canjirathinkal M, Espinoza-Figueroa J, et al. Beyond radiologic perception: a pilot quantitative and radiomic comparison between zero-echo-time MRI and CT in oncologic metastatic screening. J Radiol Oncol. 2026;10(1):009-015. Available from: https://dx.doi.org/https://doi.org/10.29328/journal.jro.1001086
- Sierra ED, Valenzuela R, Canjirathinkal MA, Costelloe CM, Moradi H, Madewell JE, et al. Cancer radiomic and perfusion imaging automated framework: validation on musculoskeletal tumors. JCO Clin Cancer Inform. 2024;8:e2300118. Available from: https://dx.doi.org/https://doi.org/10.1200/cci.23.00118
- Demircioğlu A. The effect of feature normalization methods in radiomics. Insights Imaging. 2024;15(1):2. Available from: https://dx.doi.org/https://doi.org/10.1186/s13244-023-01575-7
- Weisstein EW. Bonferroni correction [Internet]. MathWorld--A Wolfram Web Resource; 2004 [cited 2026 Nov 7]. Available from: https://mathworld.wolfram.com/BonferroniCorrection.html