Figure 2
Using Mathematical Procedure to Compute the Attenuation Coefficient in Spectrometry Field
Mohamed. S. Badawi*, Mohamed Elsaf, Mona. M. Gouda, Abouzeid A Thabet, Ahmed M El-Khatib, Mahmuod I Abbas and Kholud. S. Almugren
Published: 06 February, 2017 | Volume 1 - Issue 1 | Pages: 022-030
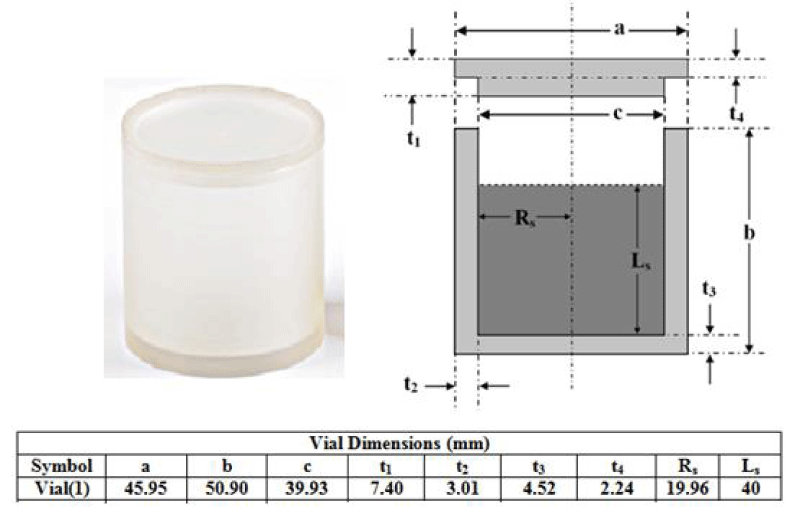
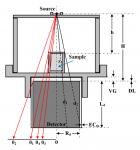
Figure 2:
The Plexiglas sample vial with cross sectional drawing and dimensions.
Read Full Article HTML DOI: 10.29328/journal.jro.1001003 Cite this Article Read Full Article PDF
More Images
Similar Articles
-
Using Mathematical Procedure to Compute the Attenuation Coefficient in Spectrometry FieldMohamed. S. Badawi*,Mohamed Elsaf,Mona. M. Gouda,Abouzeid A Thabet,Ahmed M El-Khatib,Mahmuod I Abbas,Kholud. S. Almugren. Using Mathematical Procedure to Compute the Attenuation Coefficient in Spectrometry Field. . 2017 doi: 10.29328/journal.jro.1001003; 1: 022-030
-
Empirical formulae for calculating γ-ray detectors effective solid angle ratioMohamed. S. Badawi*,Ahmed M El Khatib,Mohamed A Elzaher,Mona M Gouda,Abouzeid A Thabet,Mahmoud I Abbas,Kholud S Almugren. Empirical formulae for calculating γ-ray detectors effective solid angle ratio. . 2017 doi: 10.29328/journal.jro.1001002; 1: 012-021
-
Investigation of radiation attenuation parameters of some drugs used in Chemotherapy in Wide Energy RegionFerdi Akman*,Mustafa Recep Kaçal. Investigation of radiation attenuation parameters of some drugs used in Chemotherapy in Wide Energy Region. . 2018 doi: 10.29328/journal.jro.1001021; 2: 047-052
Recently Viewed
-
Characteristics of Juvenile Sex Offenders in PolandAnna Więcek-Durańska*. Characteristics of Juvenile Sex Offenders in Poland. J Forensic Sci Res. 2023: doi: 10.29328/journal.jfsr.1001053; 7: 072-076
-
Galenic hospital laboratory during COVID-19 emergency: A practical experience in an advanced countryLuisetto M*,Fiazza C,Ferraiuolo A,Ram Sahu. Galenic hospital laboratory during COVID-19 emergency: A practical experience in an advanced country. Int J Clin Virol. 2020: doi: 10.29328/journal.ijcv.1001027; 4: 118-125
-
Morning and Evening Exercise with or without High-Pressure Intervals have Different Effects on Controlling Blood Sugar and Glucose Fluctuations in People with Type 1 and Type 2 DiabetesReza Sheikh*. Morning and Evening Exercise with or without High-Pressure Intervals have Different Effects on Controlling Blood Sugar and Glucose Fluctuations in People with Type 1 and Type 2 Diabetes . Int J Bone Marrow Res. 2023: doi: 10.29328/journal.ijbmr.1001016; 6: 001-003
-
Comparison of clinical, chest CT and laboratory findings of suspected COVID-19 inpatients with positive and negative RT-PCRGokhan Perincek,Canver Onal,Sema Avci*. Comparison of clinical, chest CT and laboratory findings of suspected COVID-19 inpatients with positive and negative RT-PCR. J Pulmonol Respir Res. 2021: doi: 10.29328/journal.jprr.1001019; 5: 019-026
-
Harmonizing Artificial Intelligence Governance; A Model for Regulating a High-risk Categories and Applications in Clinical Pathology: The Evidence and some ConcernsMaxwell Omabe*. Harmonizing Artificial Intelligence Governance; A Model for Regulating a High-risk Categories and Applications in Clinical Pathology: The Evidence and some Concerns. Arch Pathol Clin Res. 2024: doi: 10.29328/journal.apcr.1001040; 8: 001-005
Most Viewed
-
Evaluation of Biostimulants Based on Recovered Protein Hydrolysates from Animal By-products as Plant Growth EnhancersH Pérez-Aguilar*, M Lacruz-Asaro, F Arán-Ais. Evaluation of Biostimulants Based on Recovered Protein Hydrolysates from Animal By-products as Plant Growth Enhancers. J Plant Sci Phytopathol. 2023 doi: 10.29328/journal.jpsp.1001104; 7: 042-047
-
Feasibility study of magnetic sensing for detecting single-neuron action potentialsDenis Tonini,Kai Wu,Renata Saha,Jian-Ping Wang*. Feasibility study of magnetic sensing for detecting single-neuron action potentials. Ann Biomed Sci Eng. 2022 doi: 10.29328/journal.abse.1001018; 6: 019-029
-
Physical activity can change the physiological and psychological circumstances during COVID-19 pandemic: A narrative reviewKhashayar Maroufi*. Physical activity can change the physiological and psychological circumstances during COVID-19 pandemic: A narrative review. J Sports Med Ther. 2021 doi: 10.29328/journal.jsmt.1001051; 6: 001-007
-
Pediatric Dysgerminoma: Unveiling a Rare Ovarian TumorFaten Limaiem*, Khalil Saffar, Ahmed Halouani. Pediatric Dysgerminoma: Unveiling a Rare Ovarian Tumor. Arch Case Rep. 2024 doi: 10.29328/journal.acr.1001087; 8: 010-013
-
Prospective Coronavirus Liver Effects: Available KnowledgeAvishek Mandal*. Prospective Coronavirus Liver Effects: Available Knowledge. Ann Clin Gastroenterol Hepatol. 2023 doi: 10.29328/journal.acgh.1001039; 7: 001-010

HSPI: We're glad you're here. Please click "create a new Query" if you are a new visitor to our website and need further information from us.
If you are already a member of our network and need to keep track of any developments regarding a question you have already submitted, click "take me to my Query."


