More Info
Author's satisfaction with
- Friendly and hassle-free publication process
- Less production time of articles
- Constructive peer-review
- Enhancing journal reputation
- Regular feedback system
- Quick response to authors' queries
Recently Viewed
Most Viewed
Clinical Images
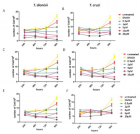
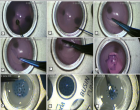
Figure 1
Imaging modalities delivery of RNAi therapeutics in cancer therapy and clinical applications
Loutfy H Madkour*
Published: 04 March, 2021 | Volume 5 - Issue 1 | Pages: 005-034
 (A) Intensity size distribution of HAI-NGs determined by DLS. (B) TEM image of HAI-NGs (scale bar: 100 nm). (C) Fluorescent spectrum of HAI-NGs before and after crosslinking by UV irradiation. The insert shows a photograph of HAI-NGs under UV light. (D) Triggered destabilization of HAI-NGs in 10 mM GSH." alt="jro-aid1035-g011"class="img-responsive img-rounded " style="cursor:pointer">
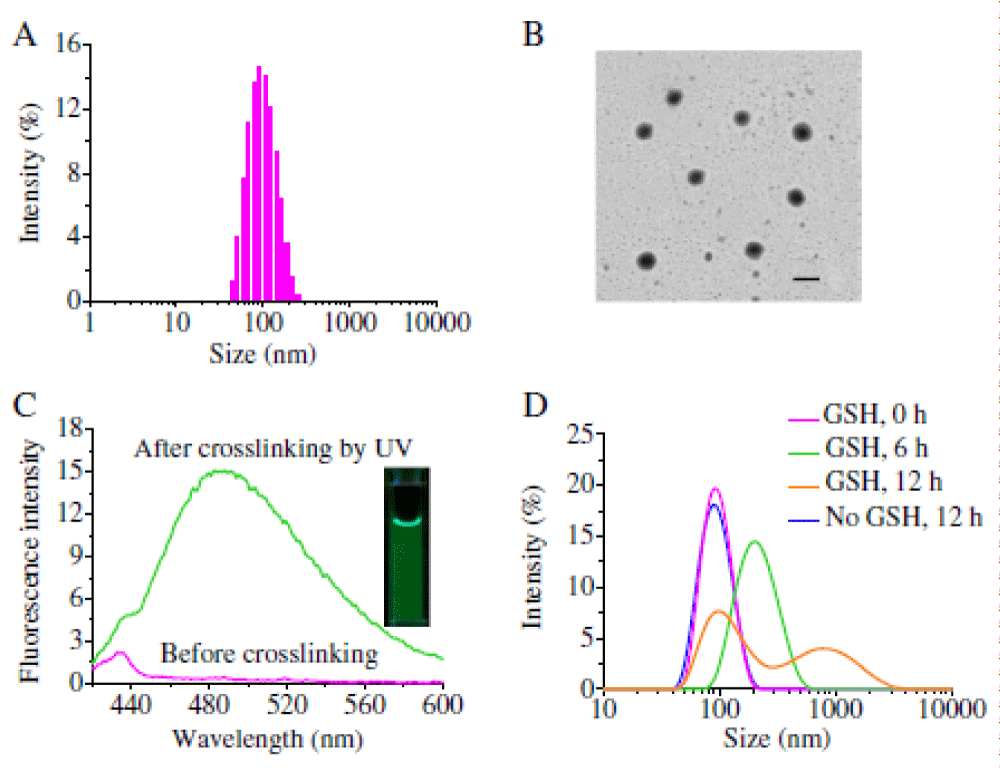
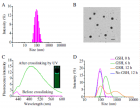
Figure 1:
(A) Intensity size distribution of HAI-NGs determined by DLS. (B) TEM image of HAI-NGs (scale bar: 100 nm). (C) Fluorescent spectrum of HAI-NGs before and after crosslinking by UV irradiation. The insert shows a photograph of HAI-NGs under UV light. (D) Triggered destabilization of HAI-NGs in 10 mM GSH.
Read Full Article HTML DOI: 10.29328/journal.jro.1001035 Cite this Article Read Full Article PDF
More Images
Similar Articles
-
Photon Absorption characteristics of some selected Enzyme Inhibitors used in Cancer Research in the Energy range 1 keV-100 GeVMustafa Recep Kaçal,Hüseyin Ali Karataş,Ferdi Akman*. Photon Absorption characteristics of some selected Enzyme Inhibitors used in Cancer Research in the Energy range 1 keV-100 GeV. . 2017 doi: 10.29328/journal.jro.1001009; 1: 060-068
-
Near Complete Response to 177Lu-PSMA-DKFZ-617 Therapy in a Patient with Metastatic Castration Resistant Prostate CancerMadhav Prasad Yadav,Sanjana Ballal a,Chandrasekhar Bal*. Near Complete Response to 177Lu-PSMA-DKFZ-617 Therapy in a Patient with Metastatic Castration Resistant Prostate Cancer. . 2017 doi: 10.29328/journal.jro.1001012; 1: 083-086
-
Hyperthermia and Breast cancer: A short reviewBora Uysal*. Hyperthermia and Breast cancer: A short review. . 2017 doi: 10.29328/journal.jro.1001011; 1: 079-082
-
Imaging modalities delivery of RNAi therapeutics in cancer therapy and clinical applicationsLoutfy H Madkour*. Imaging modalities delivery of RNAi therapeutics in cancer therapy and clinical applications. . 2021 doi: 10.29328/journal.jro.1001035; 5: 005-034
-
Anal cancer - impact of interstitial brachytherapyRegináčová K*,Kubecová M,Vránová J,Šejdová M. Anal cancer - impact of interstitial brachytherapy. . 2021 doi: 10.29328/journal.jro.1001034; 5: 001-004
-
Role of HRCT Thorax in preoperative assessment of RT-PCR COVID-19 negative oral cancer patientsRajesh A Kantharia*,Roopa Ganta,Shehnaz R Kantharia,Bhavin Bhupendra Shah,Rajinikant Mohan Vasava,Tushar Vishnuprasad Vaishnav. Role of HRCT Thorax in preoperative assessment of RT-PCR COVID-19 negative oral cancer patients. . 2020 doi: 10.29328/journal.jro.1001033; 4: 008-011.
-
8 Gy single dose radiotherapy for bone metastasis in COVID-19 pandemia period: ReviewBora Uysal*,Hakan Gamsız,Ferrat Dincoglan,Omer Sager,Selcuk Demiral ,Murat Beyzadeoglu. 8 Gy single dose radiotherapy for bone metastasis in COVID-19 pandemia period: Review. . 2020 doi: 10.29328/journal.jro.1001032; 4: 005-007.
-
Percentage of Positive Biopsy Cores Predicts Presence of a Dominant Lesion on MRI in Patients with Intermediate Risk Prostate CancerJason M Slater,William W Millard,Samuel M Randolph,Thomas J Kelly,David A Bush*. Percentage of Positive Biopsy Cores Predicts Presence of a Dominant Lesion on MRI in Patients with Intermediate Risk Prostate Cancer. . 2018 doi: 10.29328/journal.jro.1001025; 2: 073-079
-
Adaptive planning and toxicities of uniform scanning proton therapy for lung cancer patientsYuanshui Zheng*,Hardev Singh,Suresh Rana,Gary Larson,Prabhu Kiran,Lucius Doh,James Wong. Adaptive planning and toxicities of uniform scanning proton therapy for lung cancer patients. . 2018 doi: 10.29328/journal.jro.1001023; 2: 055-061
-
Incidental findings in traditional nuclear medicine practiceGiuseppe De Vincentis,Mariano Pontico,Maria Ricci,Viviana Frantellizzi*,Mauro Liberatore. Incidental findings in traditional nuclear medicine practice. . 2018 doi: 10.29328/journal.jro.1001019; 2: 036-040
Recently Viewed
-
Modulation of atrial natriuretic peptide receptors in ovarian folliculogenesisSung Zoo Kim*. Modulation of atrial natriuretic peptide receptors in ovarian folliculogenesis. Insights Clin Cell Immunol. 2022: doi: 10.29328/journal.icci.1001019; 6: 001-007
-
Prospective Coronavirus Liver Effects: Available KnowledgeAvishek Mandal*. Prospective Coronavirus Liver Effects: Available Knowledge. Ann Clin Gastroenterol Hepatol. 2023: doi: 10.29328/journal.acgh.1001039; 7: 001-010
-
Clinical and Epidemiological Profile of Reversible Acute Kidney Injury with Full Recovery: Experience of a Nephrology DepartmentNouha Ben Mahmoud*, Mouna Hamouda, Jihene Maatoug, Meriem Ben Salem, Manel Ben Salah, Ahmed Letaief, Sabra Aloui, Habib Skhiri. Clinical and Epidemiological Profile of Reversible Acute Kidney Injury with Full Recovery: Experience of a Nephrology Department. J Clini Nephrol. 2023: doi: 10.29328/journal.jcn.1001114; 7: 078-084
-
Update on the Use of Mesenchymal Stem Cells in the Treatment of Various Infectious Diseases Including COVID-19 InfectionKhalid A Al-Anazi*, Rehab Y Al-Ansari. Update on the Use of Mesenchymal Stem Cells in the Treatment of Various Infectious Diseases Including COVID-19 Infection. J Stem Cell Ther Transplant. 2023: doi: 10.29328/journal.jsctt.1001033; 7: 034-042
-
CVS: An Effective Strategy to Prevent Bile Duct InjurySardar Rezaul Islam*, Debabrata Paul, Shah Alam Sarkar, Mohammad Hanif Emon, Tania Ahmed. CVS: An Effective Strategy to Prevent Bile Duct Injury. Arch Surg Clin Res. 2024: doi: 10.29328/journal.ascr.1001080; 8: 027-031
Most Viewed
-
Evaluation of Biostimulants Based on Recovered Protein Hydrolysates from Animal By-products as Plant Growth EnhancersH Pérez-Aguilar*, M Lacruz-Asaro, F Arán-Ais. Evaluation of Biostimulants Based on Recovered Protein Hydrolysates from Animal By-products as Plant Growth Enhancers. J Plant Sci Phytopathol. 2023 doi: 10.29328/journal.jpsp.1001104; 7: 042-047
-
Feasibility study of magnetic sensing for detecting single-neuron action potentialsDenis Tonini,Kai Wu,Renata Saha,Jian-Ping Wang*. Feasibility study of magnetic sensing for detecting single-neuron action potentials. Ann Biomed Sci Eng. 2022 doi: 10.29328/journal.abse.1001018; 6: 019-029
-
Physical activity can change the physiological and psychological circumstances during COVID-19 pandemic: A narrative reviewKhashayar Maroufi*. Physical activity can change the physiological and psychological circumstances during COVID-19 pandemic: A narrative review. J Sports Med Ther. 2021 doi: 10.29328/journal.jsmt.1001051; 6: 001-007
-
Pediatric Dysgerminoma: Unveiling a Rare Ovarian TumorFaten Limaiem*, Khalil Saffar, Ahmed Halouani. Pediatric Dysgerminoma: Unveiling a Rare Ovarian Tumor. Arch Case Rep. 2024 doi: 10.29328/journal.acr.1001087; 8: 010-013
-
Prospective Coronavirus Liver Effects: Available KnowledgeAvishek Mandal*. Prospective Coronavirus Liver Effects: Available Knowledge. Ann Clin Gastroenterol Hepatol. 2023 doi: 10.29328/journal.acgh.1001039; 7: 001-010
Contact
Select by Volume & Issue
Most Viewed Keywords
- Congenital absence of bilateral coronary ostia
- COVID-19
- Nematicides
- Radium
- Tumours of the uterine corpus
- Uterus
- Age-related macular degeneration
- Relapsing polychondritis
- Lower extremity training
- Androgenetic alopecia
- Implants
- Lteral epicondalyitis
- Nuclear medicine
- Baseball shoulder
- Neuromyelitis
- Congenital megalourethra
- Papillomaviridae
- Surgical infection of soft tissues
- Natural resource
- Gold atomic clusters
University/Institution
Select and search by University/Institution.
Articles by Country
Select and search by country to get related articles.


Testmonials

I would like to thank JPRA for taking this decision. I understand the effort it represents for you. I'm truly happy to have the paper published in JPRA. And I'll certainly consider JPRA for my next publications as I was satisfied of the service provided, the efficiency and promptness of the interactions we had.
Emmanuel BUSATO
Publishing with the International Journal of Clinical and Experimental Ophthalmology was a rewarding experience as review process was thorough and brisk. Their visibility online is second to none as their published articles appear in all search engines. I will encourage researchers to publish with them.
Elizabeth Awoyesuku
“The choice to submit the forensic case study to the Journal of Addiction Therapy and Research was dictated by the match between the content and the potential readership. The publication process proved to be expedient and we were provided with constructive feedback from reviewers. The final article layout is attractive and conforms to standards. All-in-all, it has been a rewarding process.”
Elisabeth H Wiig
Archives of Vascular Medicine is one of the top class journal for vascular medicine with highly interesting topics. You did a professional and great Job!
Elias Noory
Thank you very much. I think the review process and all of what concerns the administration of the publication concerning our paper has been excellent. The nice and quick answers have been very good I think.
Doris Nilsson
Journal of Pulmonary and Respiratory Research is good journal for respiratory research purposes. It takes 2-3 weeks maximum for review of the manuscript to get published and any corrections to be made in the manuscript. It needs good articles and studies to get publish in the respiratory medicine. I am really glad that this journal editors helped me to get my case report published.
Divya Khanduja
Thanks you and your colleague for the great help for our publication. You always provide prompt responses and high quality of service. I am so happy to have you working with me. Thanks again!
Diana (Ding) Dai
Service and process were excellent as was the “look” of the article when published.
Deane Waldman
Great, thank you! It was very efficient working w/ your group. Very thorough reviews (i.e., plagiarism, peer, etc.). Would certainly recommend that future authors consider working w/ your group.
David W Brett
Your services are very good
Chukwuka Ireju Onyinye
I very much appreciate the humanitarian services provided in my stead by this journal/publisher. It exhibits total absence of editorial impertinence. As an Author, I have been guided to have a fruitful experience. The editorial care is highly commendable.
Chrysanthus Chukwuma
"An amazing experience with the Journal of Advanced Pediatrics and Child Health. Very fast blind review with pertinent corrections and suggestions. I highly recommand both the journal and the editor."
Chaimae Khairoun
The submission is very easy and the time from submission to response from the reviewers is short. Correspondence with the journal is nice and rapid.
Catrin Henriksson
The Clinical Journal of Obstetrics and Gynecology is an open access journal focused on scientific knowledge publication with emphasis laid on the fields of Gynecology and Obstetrics. Their services toward us have been encouraging through their kindness and respect. Great consideration has been given to us as young budding researchers and we are very grateful for this.
Carole Assontsa
During the process your positive communication, prompt feedback and professional approach is very highly appreciated. We would like to thank you very much for your support.
Can Vuran
I do appreciate for your service including submission, analysis, review, editorial and publishing process. I believe these esteemed journal enlighten the science with its high-quality personel.
Bora Uysal
I am very much pleased with the fast track publication by your reputed journal's editorial team. It is really helpful for researchers like me from developing nations. I strongly recommend your journal for publication.
Badri Kumar Gupta
It has been a fabulous journey writing articles for your journal because of the encouragement you people provide for writers from developing nations like India. Kindly continue the same. Looking forward for a long term association.
Badareesh Lakshminarayana
Many thanks for publishing my article in your great journal and the friendly and hassle-free publication process, the constructive peer-review, the regular feedback system, and the Quick response to any queries.
Azab Elsayed Azab
I would like to thank this journal for publishing my Research Article. Something I really appreciate about this journal is, they did not take much time from the day of Submission to the publishing date. Looking forward to have more publications in future.
Ayush Chandra
Submission of paper was smooth, the review process was fast. I had excellent communication and on time response from the editor.
Ayokunle Dada
Your service is very good and fast reply, also your service understand our situation and support us to publication our articles.
Ayman M Abu Mustafa
Really good service with prompt response. Looking forward to having long lasting relationship with your journal
Avishek Bagchi
Your service is excellent. Processing and editing were very fast. I hope to publish more of my works in your journal.
Ausraful Islam
I wanna to thank Clinical Journal of Nursing Care and Practice for its effort to review and publish my manuscript. This is reputable journal. Thank you!
Atsedemariam Andualem
“It was a delightful experience publishing my manuscript with the Clinical Journal of Obstetrics and Gynecology. They offered me lots of opportunities I never had from most publishing houses and their prompt services are greatly appreciated.”
Asafo Jones
I hope to ability to make some new investigation and publish in Your Company in future.
Artur Stopyra
I like the quality of the print & overall service. The paper looks quite impressive. Hope this will attract interested readers. All of you have our best wishes for continued success.
Arshad Khan
Your big support from researchers around the world is the best appreciation from your scientific teams. We believe that there should be no barrier in science and you make it real and this motto come true.
Arefhosseinir Rafi
Your journal co-operation is very appreciable and motivational. I am really thankful to your journal and team members for the motivation and collaboration to publish my work.
Assistant Professor, UCLAS Uttaranchal University, Dehradun, India
Archna Dhasmana
I am glad to submit the article to Heighten Science Publications as it has a very smooth and fast peer-review process, which enables the researchers to communicate their work on time.
Anupam M
This is to specify that I have had an extensive and detailed interaction with the Editorial team of Annals of Clinical Gastroenterology and Hepatology, USA, lasting over a significant period of time. My interaction has been extremely pleasant, especially with Ms Allie Smith, as I find the communication quite inspiring and crystal clear. The attitude of aforesaid individuals is quite helpful and guiding in pertinent instances. It has been a commemorative journey so far working with the Journal and I hope that the symbiosis will continue, evolve and flourish in the forthcoming years. I wish the journal, related personnel and aforementioned individuals a fruitful, successful run.
New Delhi, India
Anubha Bajaj
We appreciate the fact that you decided to give us full waiver for the applicable charges and approve the final version. You did an excellent job preparing the PDF version. Of course we will consider your magazine for our future submissions and we will pay the applicable fees then.
Anna Dionysopoulou
''Co-operation of Archives of Surgery and Clinical Research journal is appreciable. I'm impressed at the promptness of the publishing staff and the professionalism displayed. Thank you very much for your support, help and encouragement.''
Anıl Gokce
Congratulations for the excellence of your journal and high quality of its publications.
Angel MARTIN CASTELLANOS
The service from the journal staff has been excellent.
Andy Smith
I was very pleased with the quick editorial process. We are sure that our paper will have great visibility, among other things due to its open access. We believe in science accessible to all.
Anderson Fernando de Souza
It was a great experience publishing through JCICM. The article has reached out to several institutions. Appreciate your professional work. Hope to work with you again
Anas Wardeh
Publishing an article is a long process, but working with your publication department made things go smoothly, even though the process took exactly 5 months from the time of submitting the article till the time I have favourable response, the missing part is the peer review details, which is essential in self auditing and future improvement, overall experience was excellent giving your understanding of the situation of lack of financial institution support.
Anas Diab
I think that Heighpubs very good. You are very helpful. Thank you for everything.
Ana Ribeiro
Regarding to be services, we note that are work with high standards of professionalism translated into quick response, efficiency which makes communication accessible. Furthermore, I believe to be much inviting for the submission of future works for publication purposes.
Amélia João Alice Nkutxi
I would like to mention that I had a wonderful experience working with HSPI. The whole process right from manuscript submission to peer review till the publication of the article was very prompt & efficient. I wish you good luck for the future.
Amarjeet Gambhir
Once I submitted the manuscript, the response time of the reviewers was very fast. The fine-tuning of the galley proof was likewise prompt. I believe the journal provide a valuable outlet to disseminate physical rehabilitation scientific knowledge to the clinical community. Respectfully. Dr. Alon
Alon
We really appreciate and thanks the full waiver you provide for our article. We happy to publish our paper in your journal. Thank you very much for your good support and services.
Ali Abusafia
It was a real pleasure working with your team. The review was done fast, and it was very clear, the editing was flawless, the article was published quickly compared to other journals, and everyone was understanding and helpful. I will gladly recommend this journal to my acquaintances in academia.
Alexandra Cozma
To the editorial team at HSPI and the Journal of Clinical Nephrology: Thank you so much for your hard work and collaboration in bringing our article to life. Your staff was responsive, flexible, and communicative and made the process smooth and easy. Thank you!
Alejandro Munoz
Dear colleagues! I am satisfied with our cooperation with you. Your service is at a high level. I hope for a future relationship. Let me know if I can get a paper version of the magazine with my articles from you. I see them on the Internet.
Aksenov V.V
"This is my first time publishing with the journal/publisher. I am impressed at the promptness of the publishing staff and the professionalism displayed. Thank you for encouraging young researchers like me!"
Ajite Kayode
I want to thank you for our collaboration. You were fast and effective with a positive spirit of teamwork. I am truly excited from our collaboration. You were like always fast, efficient and accurate. I hope that in the near future we will collaborate again.
Aikaterini Solomou
In my opinion, you provide a very fast and practical service.
Ahmet Eroglu
Great, We are too comfortable with the process including the peer review process and quality. But, the journal should be indexed in different databases such scopus.
Afework Edmealem
We really appreciate your efforts towards our article, the professional way you handle our request for exemption from charges. It was a great honor for us to publish in your magazine.
Achraf elbakkaly
I really liked the ease of submitting my manuscript in the HSPI journal. Further, the peer review was timely completed and I was communicated the final decision on my manuscript within 10 days of submission which is really appreciable. I strongly recommend all the scientists and researchers to submit their work in this journal”
Abu Bashar
My candid opinion is that the service you render is second to none. My favourite part is the prompt response to issue, really i value that.
Abiodun Akanbi Adeogun
Thank you very much for accepting our manuscript in your journal “International Journal of Clinical Virology”. We are very thankful to the esteemed team for timely response and quick review process. The editorial team of International Journal of Clinical Virology is too cooperative and well-mannered during the publication process. We are hopeful to publish many quality papers in your journal and I suggest the International Journal of Clinical Virology to all of my colleagues, researchers and friends to publish their research here.
Abdul Baset
I, Muhammad Sarwar Khan, am serving as Editor on Archives of Biotechnology and Biomedicine (ABB). I submitted an editorial titled, 'Edible vaccines to combat Infectious Bursal Disease of poultry' for publication in ABB. After submitting the manuscript; the services rendered by the management and technical personnel to handle and process the manuscript were marvelous. Plagiarism report was shared with me with complements before reviewers' comments, All steps including article processing and service charges were well taken care of keeping in view the author's interest/preference. All together, it was an encouraging and wonderful experience working with ABB personnel.
University of Agriculture, Pakistan
Muhammad Sarwar Khan
Your journal has accomplished its intended mission of providing very effective and efficient goals in dealing with submissions, conducting the reviewing process and in publishing accepted manuscripts in a timely manner. Keep up the great work and services that you provide.
University of Jacqmar, Inc., USA
John St. Cyr
I am to express my view that Heighten Science Publications are reliable quick even after peer review process. I hope and wish the publications will go a long way in disseminating science to many interested in scientific research.
College of Fisheries, CAU(I), Tripura, India
Ajit Kumar Roy
The Journal Clinical Nephrology provides a good opportunity for readers to stay updated in the field of clinical nephrology. Additionally - it provides a good opportunity for authors to publish their work. 1. Publication of the accepted manuscripts is sufficiently rapid. 2. The trust factor between the journal and me, as an author, is very important and well preserved. 3. Peer review process very rapid and effective.
Assaf Harofeh Medical Center, Israel
Leonid Feldman
In 2017, I submitted a manuscript to the journal Archives of Biotechnology and Biomedicine belonging to Heighten Science Publications Corporation. Within one week I already received the response from the editor. All processing steps were really fast so in terms of a speedy publication I can particularly recommend the journal Archives of Biotechnology and Biomedicine. The responsible contact person of the journal was always available, which gives a trustworthy impression to the author. Also the peer review process was clear and constructive. So from my experience with Heighten Science Publications Corporation I can recommend publishing there.
University of Tubingen, Germany
Yvonne Mast
We thank to the heighten science family, who speed up the publication of our article and provide every support.
Mehmet Besir
The services of the journal were excellent. The most important thing for an author is the speed of the peer review which was really fast here. They returned in a few days and immediately replied all of my questions. I want to refer this platform to all scholars. Many thanks.
Eastern Mediterranean University, Cyprus
Zehra Guchan TOPCU
Thank you for your attitude and support. I am sincerely grateful to you and the entire staff of the magazine for the high professionalism and fast quality work. Thank you very much!
USA
Igor Klepikov
Thank you and your company for effective support of authors which are very much dependable on the funds gambling for science in the different countries of our huge and unpredictable world. We are doing our work and should rely on a teams like Galley Proof-HSPC. Great success to all of you for the 2019th! Be well all the year long.
Russia
Victor V Apollonov
The editorial process was quickly done. The galley proof was sent within a week after being accepted for publication. The editorial team was very helpful and responded promptly.
India
Rohit Kulshrestha
Publishing with the International Journal of Clinical and Experimental Ophthalmology was a rewarding experience as review process was thorough and brisk. Their visibility online is second to none as their published articles appear in all search engines. I will encourage researchers to publish with them.
University of Port Harcourt Teaching Hospital, Nigeria
Dr. Elizabeth A Awoyesuku
"It was a pleasure to work with the editorial team of the journal on the submission of the manuscript. The team was professional, fast, and to the point".
NC A&T State University, USA
Moran Sciamama-Saghiv
Submission of paper was smooth, the review process was fast. I had excellent communication and on time response from the editor.
Ekiti State University Teaching Hospital, Nigeria
Ayokunle Dada
I am delighted and satisfied with. Heighten Science Publications as my manuscript was thoroughly assessed and published on time without delay. Keep up the good work.
Ido-Ekiti/Afe Babalola University, Nigeria
Dr. Shuaib Kayode Aremu
"This is my first time publishing with the journal/publisher. I am impressed at the promptness of the publishing staff and the professionalism displayed. Thank you for encouraging young researchers like me!"
Ekiti State University, Nigeria
Adebukola Ajite
I wanna to thank clinical journal of nursing care and practice for its effort to review and publish my manuscript. This is reputable journal. Thank you!
Wollo University, Ethiopia
Atsedemariam Andualem
We appreciate your approach to scholars and will encourage you to collaborate with your organization, which includes interesting and different medical journals. With the best wishes of success, creativity and joy in life, prosperity in the medical field.
Ivano- Frankivsk National Medical University, Ukraine
Nataliya Kitsera
Thank you very much for your support and encouragement. I am truly impressed by your tolerance and support. Thank you very much
Diaverum: PADC, Jeddah, Saudi Arabia
Nasrulla Abutaleb
You are such a nice person. Your journal co-operation is very appreciable and motivational.
Department of Biotechnology, Uttaranchal college of Applied and Life Sciences, Uttaranchal University, Dehradun, Uttarakhand, India
Archna Dhasmana
“Mobile apps and wearable technology are becoming ubiquitous in our environment. Their integration with healthcare delivery is just beginning to take shape. The early results are promising and the possibilities great."
BS, PharmD., MBA, CPHIMS, FHIMSS, Adjunct Professor, Global Healthcare Management, MCPHS University, Chief Strategy Offi cer, MedicaSoft, Senior Advisor, National Health IT (NHIT) Collaborative for Underserved, New York HIMSS, National Liaison, Health 2.0 Boston, Past Chair, Chair Innovation, USA
Helen Figge
“The choice to submit the forensic case study to the Journal of Addiction Therapy and Research was dictated by the match between the content and the potential readership. The publication process proved to be expedient and we were provided with constructive feedback from reviewers. The final article layout is attractive and conforms to standards. All-in-all, it has been a rewarding process.”
Ph.D, Boston University Department of Communication Sciences and Disorders and Knowledge Research Institute, Inc., 2131 Reflection Bay Drive, Arlington, Texas 76013, USA
Elisabeth H. Wiig
The service is nice and the time of processing the application is fast.
Department of Neurosurgery, Queen Elizabeth Hospital, Hong Kong
Long Ching
Your service is very good and fast reply, Also your service understand our situation and support us to publication our articles.
Palestine College of Nursing, Khan Younis, Gaza Strip, Palestine
Ayman M Abu Mustafa
“It was a delightful experience publishing my manuscript with the Clinical Journal of Obstetrics and Gynecology. They offered me lots of opportunities I never had from most publishing houses and their prompt services are greatly appreciated.”
Department of Agricultural Economics, Agribusiness and Extension, Kwame Nkrumah University of Science and Technology, Kumasi, Ghana
Akowuah Jones Asafo
Related Journals

HSPI: We're glad you're here. Please click "create a new Query" if you are a new visitor to our website and need further information from us.
If you are already a member of our network and need to keep track of any developments regarding a question you have already submitted, click "take me to my Query."