Figure 5
Imaging modalities delivery of RNAi therapeutics in cancer therapy and clinical applications
Loutfy H Madkour*
Published: 04 March, 2021 | Volume 5 - Issue 1 | Pages: 005-034
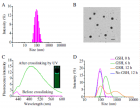
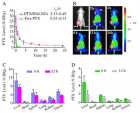
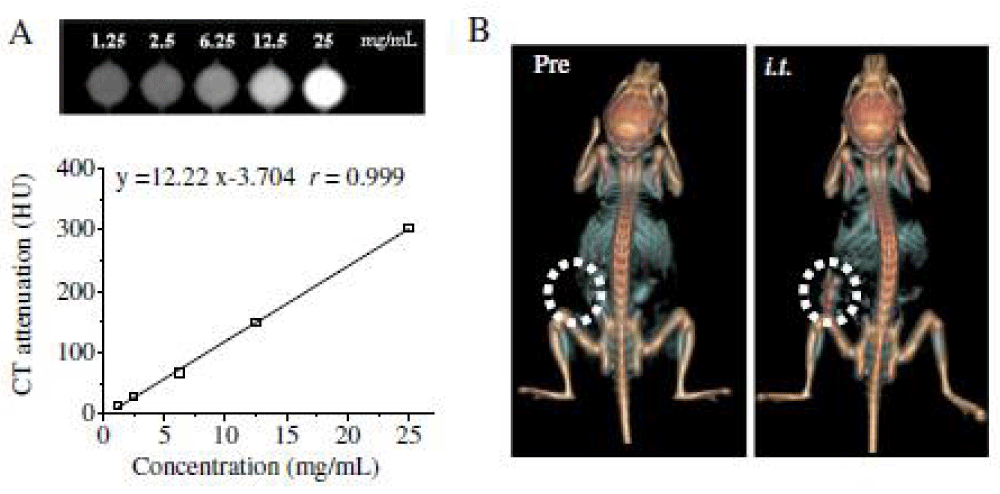 (A) HU measurements of HAI-NGs. The plot showed a linear correlation of CT calculated solution attenuation measured in Hounsfield units (HU) to HAI-NGs at varying concentrations from 1.25 to 25 mg/mL. (B) Three-dimensional reconstructed CT images of the MCF-7 tumor bearing mice following intratumoral (i.t.) injection of 50 μL of HAI-NGs at a concentration of 15 mg/mL (60 mg iodine equiv./kg). Circled areas indicate the location of the tumor." alt="jro-aid1035-g015"class="img-responsive img-rounded " style="cursor:pointer">
Figure 5:
(A) HU measurements of HAI-NGs. The plot showed a linear correlation of CT calculated solution attenuation measured in Hounsfield units (HU) to HAI-NGs at varying concentrations from 1.25 to 25 mg/mL. (B) Three-dimensional reconstructed CT images of the MCF-7 tumor bearing mice following intratumoral (i.t.) injection of 50 μL of HAI-NGs at a concentration of 15 mg/mL (60 mg iodine equiv./kg). Circled areas indicate the location of the tumor.
Read Full Article HTML DOI: 10.29328/journal.jro.1001035 Cite this Article Read Full Article PDF
More Images
Similar Articles
-
Photon Absorption characteristics of some selected Enzyme Inhibitors used in Cancer Research in the Energy range 1 keV-100 GeVMustafa Recep Kaçal,Hüseyin Ali Karataş,Ferdi Akman*. Photon Absorption characteristics of some selected Enzyme Inhibitors used in Cancer Research in the Energy range 1 keV-100 GeV. . 2017 doi: 10.29328/journal.jro.1001009; 1: 060-068
-
Near Complete Response to 177Lu-PSMA-DKFZ-617 Therapy in a Patient with Metastatic Castration Resistant Prostate CancerMadhav Prasad Yadav,Sanjana Ballal a,Chandrasekhar Bal*. Near Complete Response to 177Lu-PSMA-DKFZ-617 Therapy in a Patient with Metastatic Castration Resistant Prostate Cancer. . 2017 doi: 10.29328/journal.jro.1001012; 1: 083-086
-
Hyperthermia and Breast cancer: A short reviewBora Uysal*. Hyperthermia and Breast cancer: A short review. . 2017 doi: 10.29328/journal.jro.1001011; 1: 079-082
-
Imaging modalities delivery of RNAi therapeutics in cancer therapy and clinical applicationsLoutfy H Madkour*. Imaging modalities delivery of RNAi therapeutics in cancer therapy and clinical applications. . 2021 doi: 10.29328/journal.jro.1001035; 5: 005-034
-
Anal cancer - impact of interstitial brachytherapyRegináčová K*,Kubecová M,Vránová J,Šejdová M. Anal cancer - impact of interstitial brachytherapy. . 2021 doi: 10.29328/journal.jro.1001034; 5: 001-004
-
Role of HRCT Thorax in preoperative assessment of RT-PCR COVID-19 negative oral cancer patientsRajesh A Kantharia*,Roopa Ganta,Shehnaz R Kantharia,Bhavin Bhupendra Shah,Rajinikant Mohan Vasava,Tushar Vishnuprasad Vaishnav. Role of HRCT Thorax in preoperative assessment of RT-PCR COVID-19 negative oral cancer patients. . 2020 doi: 10.29328/journal.jro.1001033; 4: 008-011.
-
8 Gy single dose radiotherapy for bone metastasis in COVID-19 pandemia period: ReviewBora Uysal*,Hakan Gamsız,Ferrat Dincoglan,Omer Sager,Selcuk Demiral ,Murat Beyzadeoglu. 8 Gy single dose radiotherapy for bone metastasis in COVID-19 pandemia period: Review. . 2020 doi: 10.29328/journal.jro.1001032; 4: 005-007.
-
Percentage of Positive Biopsy Cores Predicts Presence of a Dominant Lesion on MRI in Patients with Intermediate Risk Prostate CancerJason M Slater,William W Millard,Samuel M Randolph,Thomas J Kelly,David A Bush*. Percentage of Positive Biopsy Cores Predicts Presence of a Dominant Lesion on MRI in Patients with Intermediate Risk Prostate Cancer. . 2018 doi: 10.29328/journal.jro.1001025; 2: 073-079
-
Adaptive planning and toxicities of uniform scanning proton therapy for lung cancer patientsYuanshui Zheng*,Hardev Singh,Suresh Rana,Gary Larson,Prabhu Kiran,Lucius Doh,James Wong. Adaptive planning and toxicities of uniform scanning proton therapy for lung cancer patients. . 2018 doi: 10.29328/journal.jro.1001023; 2: 055-061
-
Incidental findings in traditional nuclear medicine practiceGiuseppe De Vincentis,Mariano Pontico,Maria Ricci,Viviana Frantellizzi*,Mauro Liberatore. Incidental findings in traditional nuclear medicine practice. . 2018 doi: 10.29328/journal.jro.1001019; 2: 036-040
Recently Viewed
-
Update on Mesenchymal Stem CellsKhalid Ahmed Al-Anazi*. Update on Mesenchymal Stem Cells. J Stem Cell Ther Transplant. 2024: doi: 10.29328/journal.jsctt.1001035; 8: 001-003
-
Impact of Chronic Kidney Disease on Major Adverse Cardiac Events in Patients with Acute Myocardial Infarction: A Retrospective Cohort StudyAbbas Andishmand, Ehsan Zolfeqari*, Mahdiah Sadat Namayandah, Hossein Montazer Ghaem. Impact of Chronic Kidney Disease on Major Adverse Cardiac Events in Patients with Acute Myocardial Infarction: A Retrospective Cohort Study. J Cardiol Cardiovasc Med. 2024: doi: 10.29328/journal.jccm.1001175; 9: 029-034
-
Myxedema Coma and Acute Respiratory Failure in a Young Child: A Case ReportRinah Elaisse R Dolores, Marion O Sanchez*. Myxedema Coma and Acute Respiratory Failure in a Young Child: A Case Report. Ann Clin Endocrinol Metabol. 2023: doi: 10.29328/journal.acem.1001027; 7: 008-013
-
A General Evaluation of the Cellular Role in Drug Release: A Clinical Review StudyMohammad Hossein Karami* and Majid Abdouss*. A General Evaluation of the Cellular Role in Drug Release: A Clinical Review Study. Clin J Obstet Gynecol. 2024: doi: 10.29328/journal.cjog.1001162; 7: 042-050
-
Are Biofungicides a Means of Plant Protection for the Future?Radek Vavera*, Josef Hýsek. Are Biofungicides a Means of Plant Protection for the Future?. J Plant Sci Phytopathol. 2024: doi: 10.29328/journal.jpsp.1001130; 9: 041-042
Most Viewed
-
Evaluation of Biostimulants Based on Recovered Protein Hydrolysates from Animal By-products as Plant Growth EnhancersH Pérez-Aguilar*, M Lacruz-Asaro, F Arán-Ais. Evaluation of Biostimulants Based on Recovered Protein Hydrolysates from Animal By-products as Plant Growth Enhancers. J Plant Sci Phytopathol. 2023 doi: 10.29328/journal.jpsp.1001104; 7: 042-047
-
Feasibility study of magnetic sensing for detecting single-neuron action potentialsDenis Tonini,Kai Wu,Renata Saha,Jian-Ping Wang*. Feasibility study of magnetic sensing for detecting single-neuron action potentials. Ann Biomed Sci Eng. 2022 doi: 10.29328/journal.abse.1001018; 6: 019-029
-
Physical activity can change the physiological and psychological circumstances during COVID-19 pandemic: A narrative reviewKhashayar Maroufi*. Physical activity can change the physiological and psychological circumstances during COVID-19 pandemic: A narrative review. J Sports Med Ther. 2021 doi: 10.29328/journal.jsmt.1001051; 6: 001-007
-
Pediatric Dysgerminoma: Unveiling a Rare Ovarian TumorFaten Limaiem*, Khalil Saffar, Ahmed Halouani. Pediatric Dysgerminoma: Unveiling a Rare Ovarian Tumor. Arch Case Rep. 2024 doi: 10.29328/journal.acr.1001087; 8: 010-013
-
Prospective Coronavirus Liver Effects: Available KnowledgeAvishek Mandal*. Prospective Coronavirus Liver Effects: Available Knowledge. Ann Clin Gastroenterol Hepatol. 2023 doi: 10.29328/journal.acgh.1001039; 7: 001-010

HSPI: We're glad you're here. Please click "create a new Query" if you are a new visitor to our website and need further information from us.
If you are already a member of our network and need to keep track of any developments regarding a question you have already submitted, click "take me to my Query."


